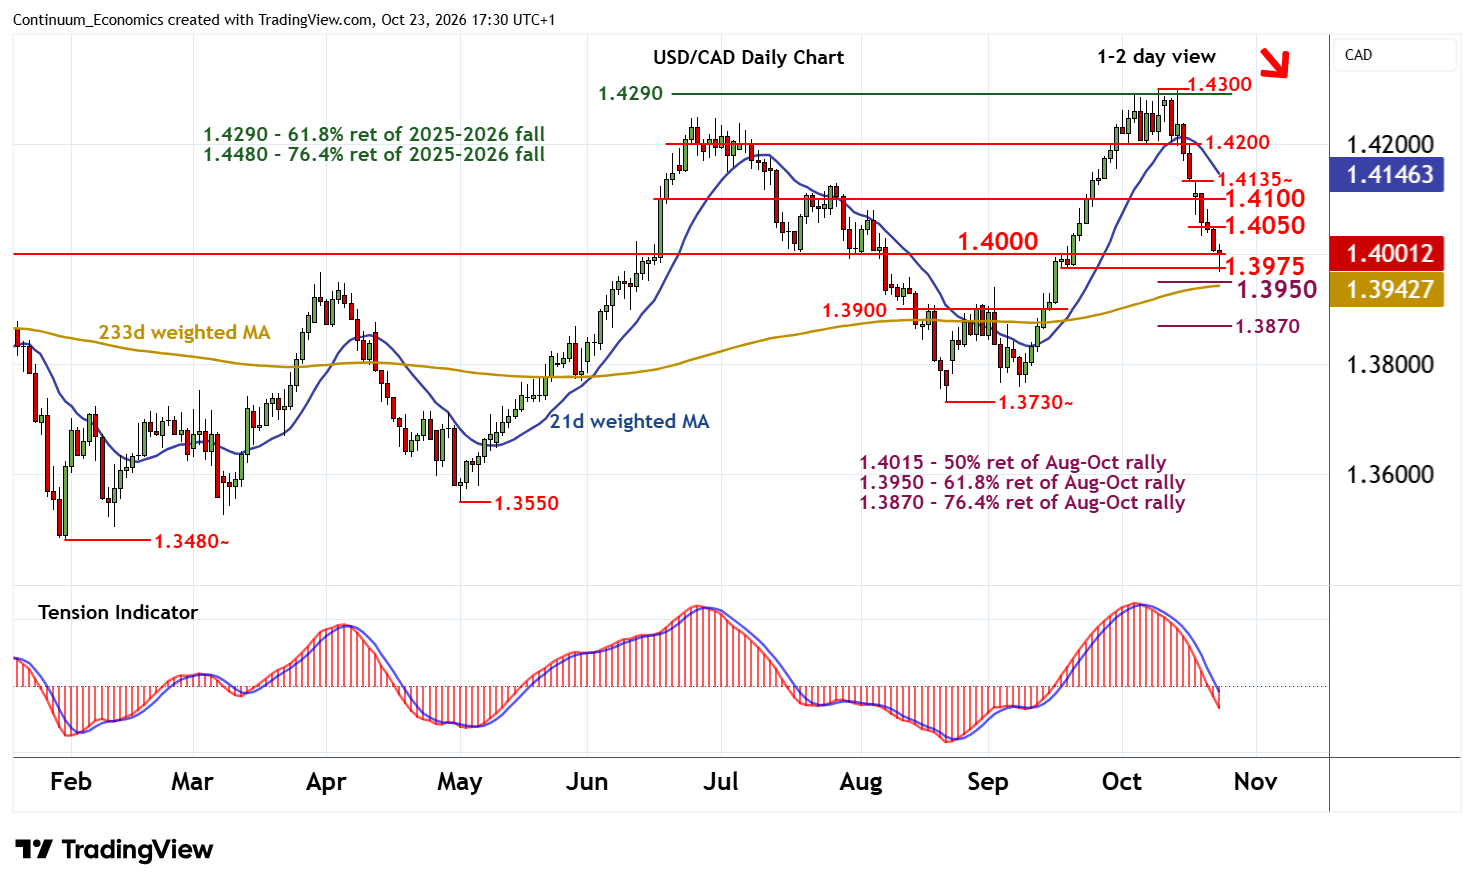
Chart USD/CAD Update: Consolidating test of support - studies under pressure
Minor consolidation has given way to anticipated continuation of October losses
| Levels | Imp | Comment | Levels | Imp | Comment | |||
|---|---|---|---|---|---|---|---|---|
| R4 | 1.4200 | ** | congestion | S1 | 1.4000 | ** | congestion | |
| R3 | 1.4135 | * | break level | S2 | 13975 | * | 17-21 Sep range lows | |
| R2 | 1.4100 | minor congestion | S3 | 1.3950 | ** | 61.8% ret of Aug-Oct rally | ||
| R1 | 1.4050 | break level | S4 | 1.3900 | * | congestion |
Asterisk denotes strength of level
16:55 BST - Minor consolidation has given way to anticipated continuation of October losses, with prices currently pressuring support within the 1.3975 range lows from 17-21 September and congestion around 1.4000. Daily stochastics are oversold, suggesting room for consolidation within here. But the daily Tension Indicator continues to fall and broader weekly charts are also under pressure, highlighting room for further losses in the coming sessions. A close beneath here will add weight to sentiment and extend October losses initially towards the 1.3950 Fibonacci retracement. Beneath here is congestion around 1.3900.
Meanwhile resistance is lowered to the 1.4050 break level. But any break should be limited in consolidation beneath congestion around 1.4100.