Chart EUR/SEK Update: Bounce from strong support not sustained - background studies under pressure
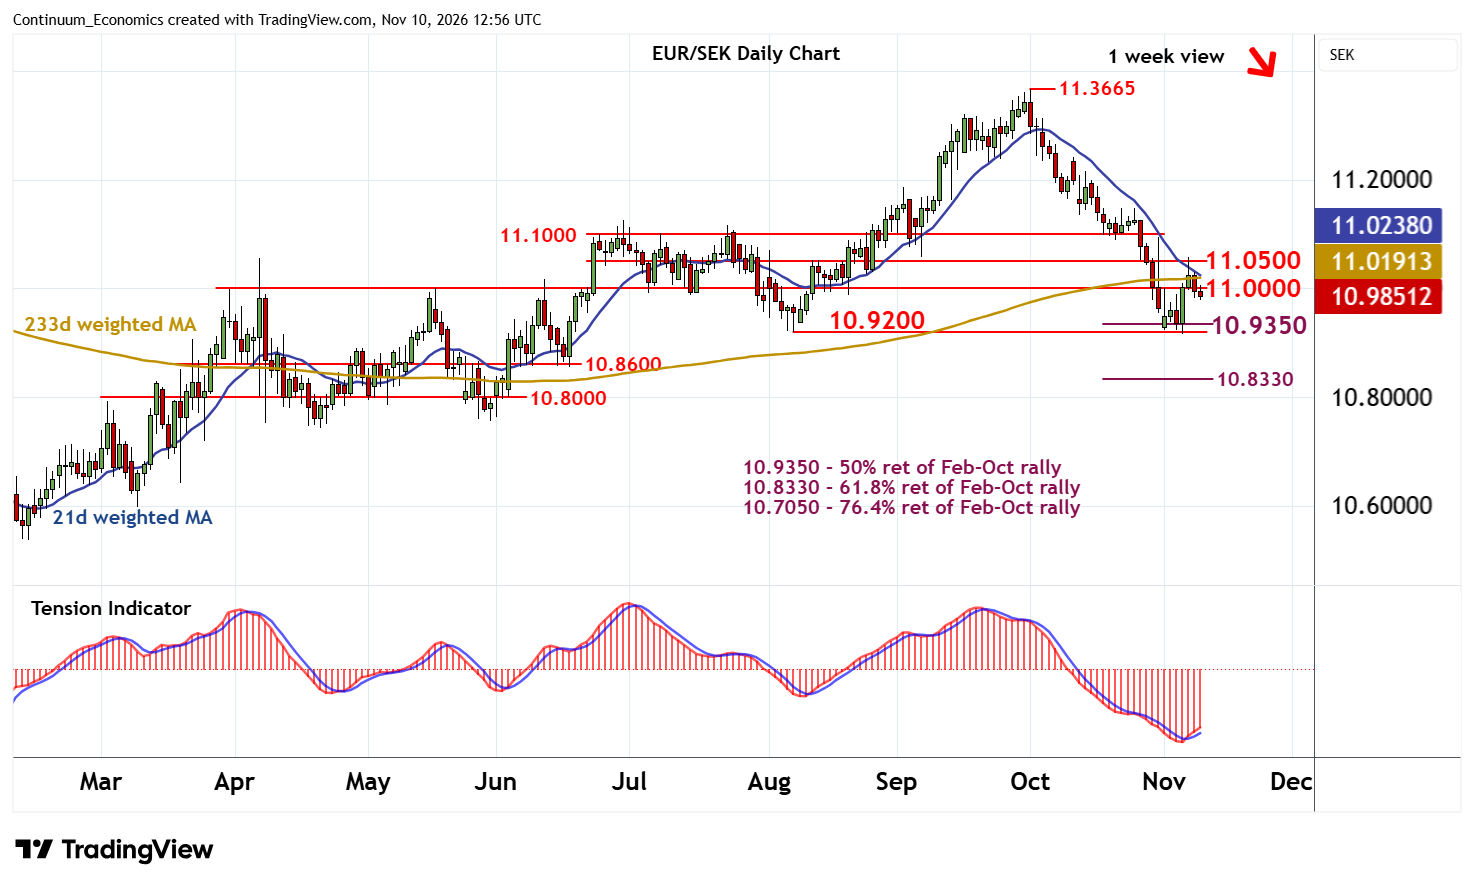
Consolidation above strong support at the 10.9200 monthly low of 7 August and the 10.9350 Fibonacci retracement has given way to a bounce
| Levels | Imp | Comment | Levels | Imp | Comment | |||
| R4 | 11.1500 | * | break level | S1 | 10.9350 | ** | 50% ret of Feb-Oct rally | |
| R3 | 11.1000 | * | congestion | S2 | 10.9200 | ** | 7 Aug (m) low | |
| R2 | 11.0500 | * | congestion | S3 | 10.8600 | * | break level | |
| R1 | 11.0000 | ** | break level | S4 | 10.8330 | ** | 61.8% ret of Feb-Oct rally |
Asterisk denotes strength of level
12:05 GMT - Consolidation above strong support at the 10.9200 monthly low of 7 August and the 10.9350 Fibonacci retracement has given way to a bounce, with prices reaching congestion around 11.0500 before settling back once again. Overbought daily stochastics are unwinding, suggesting room for a drift back towards 10.9200 - 10.9350. But the rising daily Tension Indicator should limit any initial tests in fresh consolidation, before bearish weekly charts and deteriorating longer-term readings prompt a break. A close beneath here will add weight to sentiment and extend losses from the 11.3665 current year high of 1 October below the 10.8600 break level towards the 10.8330 retracement.
Meanwhile, resistance remains at 11.0000 and extends to 11.0500. A close above here, if seen, would improve price action and signal a stronger bounce towards 11.1000.