Published: 2026-07-29T13:16:28.000Z
Chart USD/JPY Update: Choppy in range - background studies rising
2
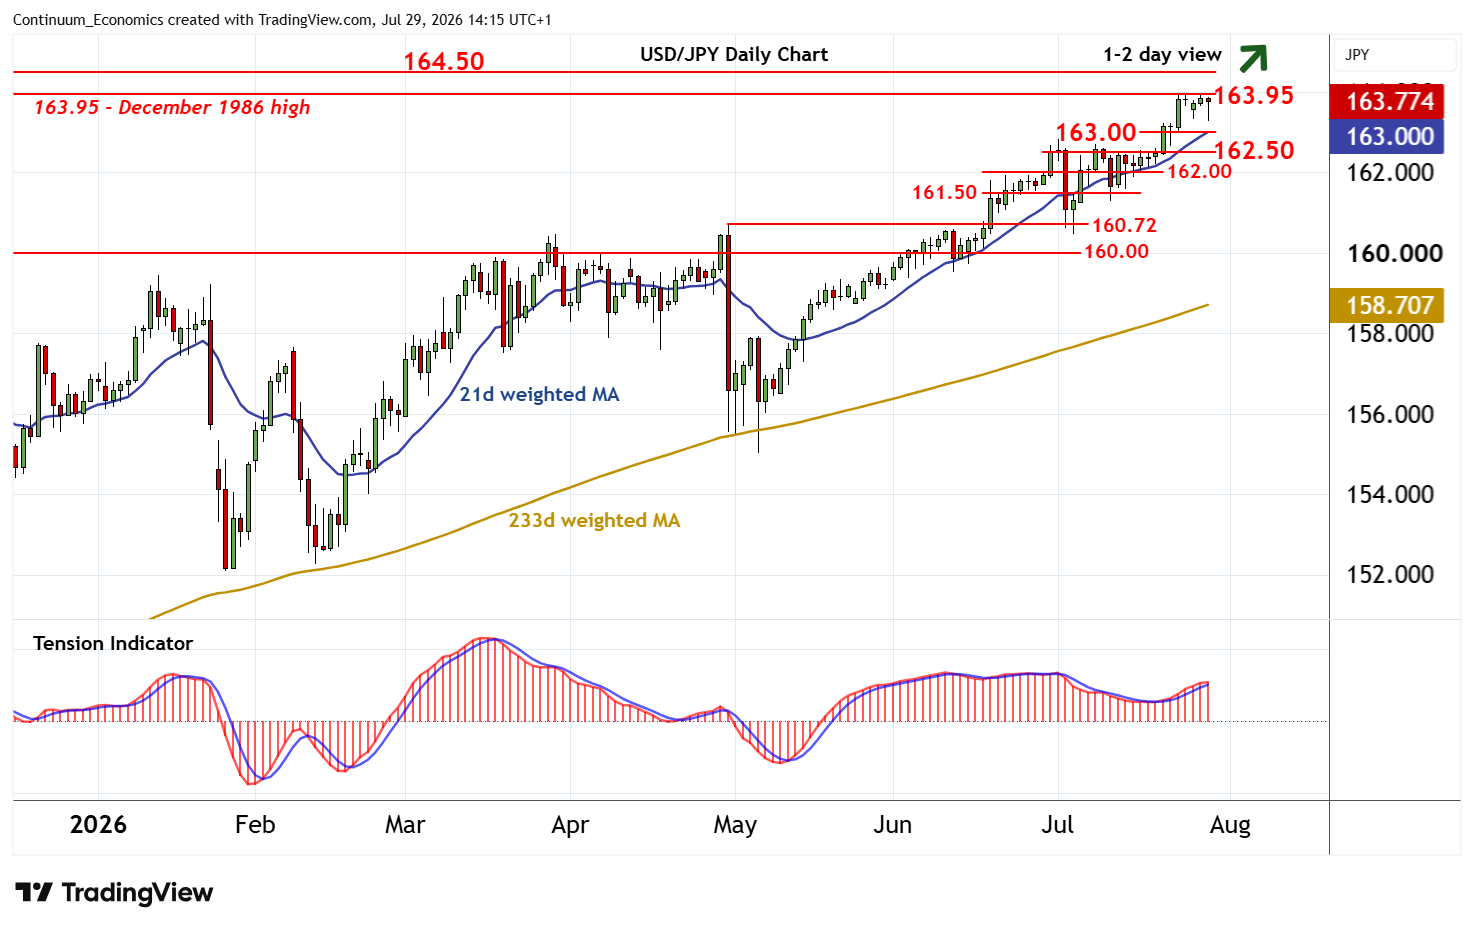
Little change, as prices extend choppy trade beneath strong resistance at the 163.95 high of December 1986
| Levels | Imp | Comment | Levels | Imp | Comment | |||
|---|---|---|---|---|---|---|---|---|
| R4 | 166.00 | ** | figure | S1 | 163.00 | congestion | ||
| R3 | 165.00 | ** | figure | S2 | 162.85~ | ** | 1 July (w) high | |
| R2 | 164.50 | ** | November 1986 high | S3 | 162.50 | * | congestion | |
| R1 | 163.95 | ** | December 1986 high | S4 | 162.00 | * | congestion |
Asterisk denotes strength of level
13:30 BST - Little change, as prices extend choppy trade beneath strong resistance at the 163.95 high of December 1986. Overbought daily stochastics are turning down and the positive daily Tension Indicator is flat, suggesting room for further consolidation. But rising weekly charts point to room for a later break. A close above here will improve sentiment and extend long-term gains towards the 164.50 high of November 1986. Meanwhile, support remains down to congestion around 163.00 and should underpin any immediate setbacks.