Published: 2026-07-31T06:58:03.000Z
Chart AUD/JPY Update: Turned up in consolidation from 110.90 low
1
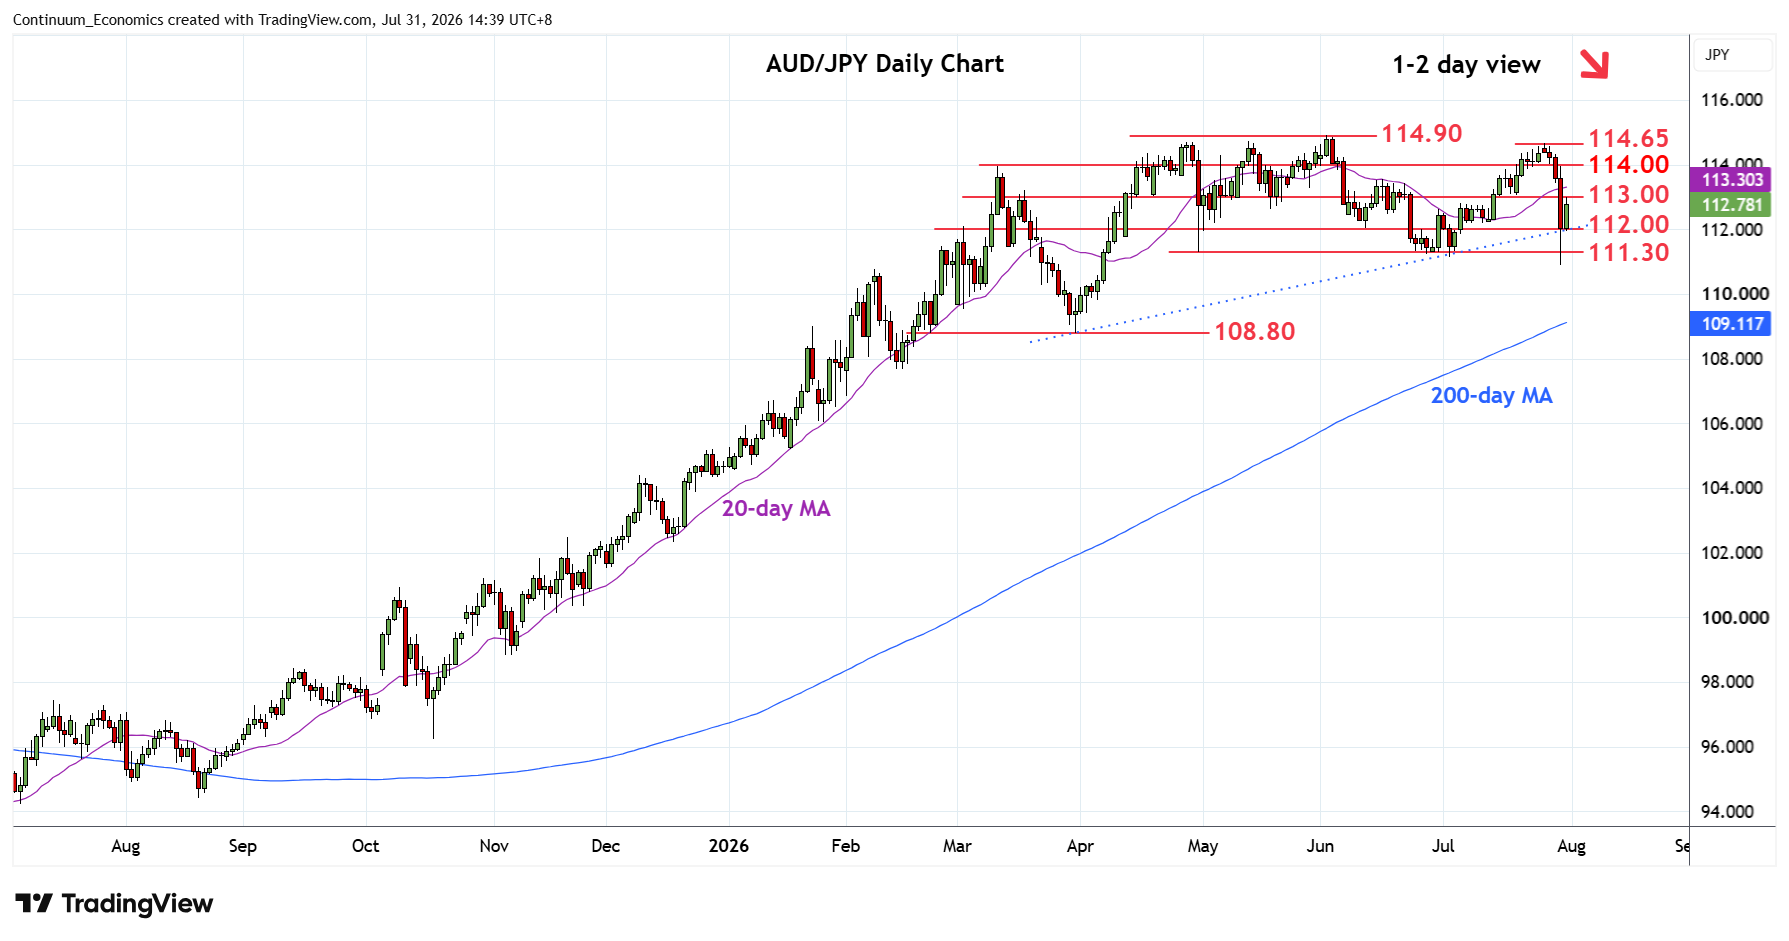
Losses through the 112.00 level and 111.30/15 support reached 110.90 low ahead of rebound to consolidate sharp losses
| Levels | Imp | Comment | Levels | Imp | Comment | |||
|---|---|---|---|---|---|---|---|---|
| R4 | 114.65 | ** | 27 Jul high | S1 | 112.00 | * | congestion | |
| R3 | 114.00 | * | congestion | S2 | 111.30/15 | ** | 30 Apr, 2 Jul lows | |
| R2 | 113.50 | * | congestion | S3 | 110.90 | ** | 30 Jul low | |
| R1 | 113.00 | * | congestion | S4 | 110.00 | * | congestion |
Asterisk denotes strength of level
06:50 GMT - Losses through the 112.00 level and 111.30/15 support reached 110.90 low ahead of rebound to consolidate sharp losses from 114.65 Monday's high. Bounce to regain the trendline from the March low see prices settling into the 112.00/113.00 range area. Stronger bounce above 113.00 level will see room to retest 113.50/114.00 area but this is expected to give way to renewed selling pressure later. Below 112.00 will expose the 111.15 and 110.90 lows to retest and threaten deeper pullback to retrace gains from the April 2025 year low.