Published: 2026-11-03T00:27:47.000Z
Chart AUD/USD Update: Leaning lower
1
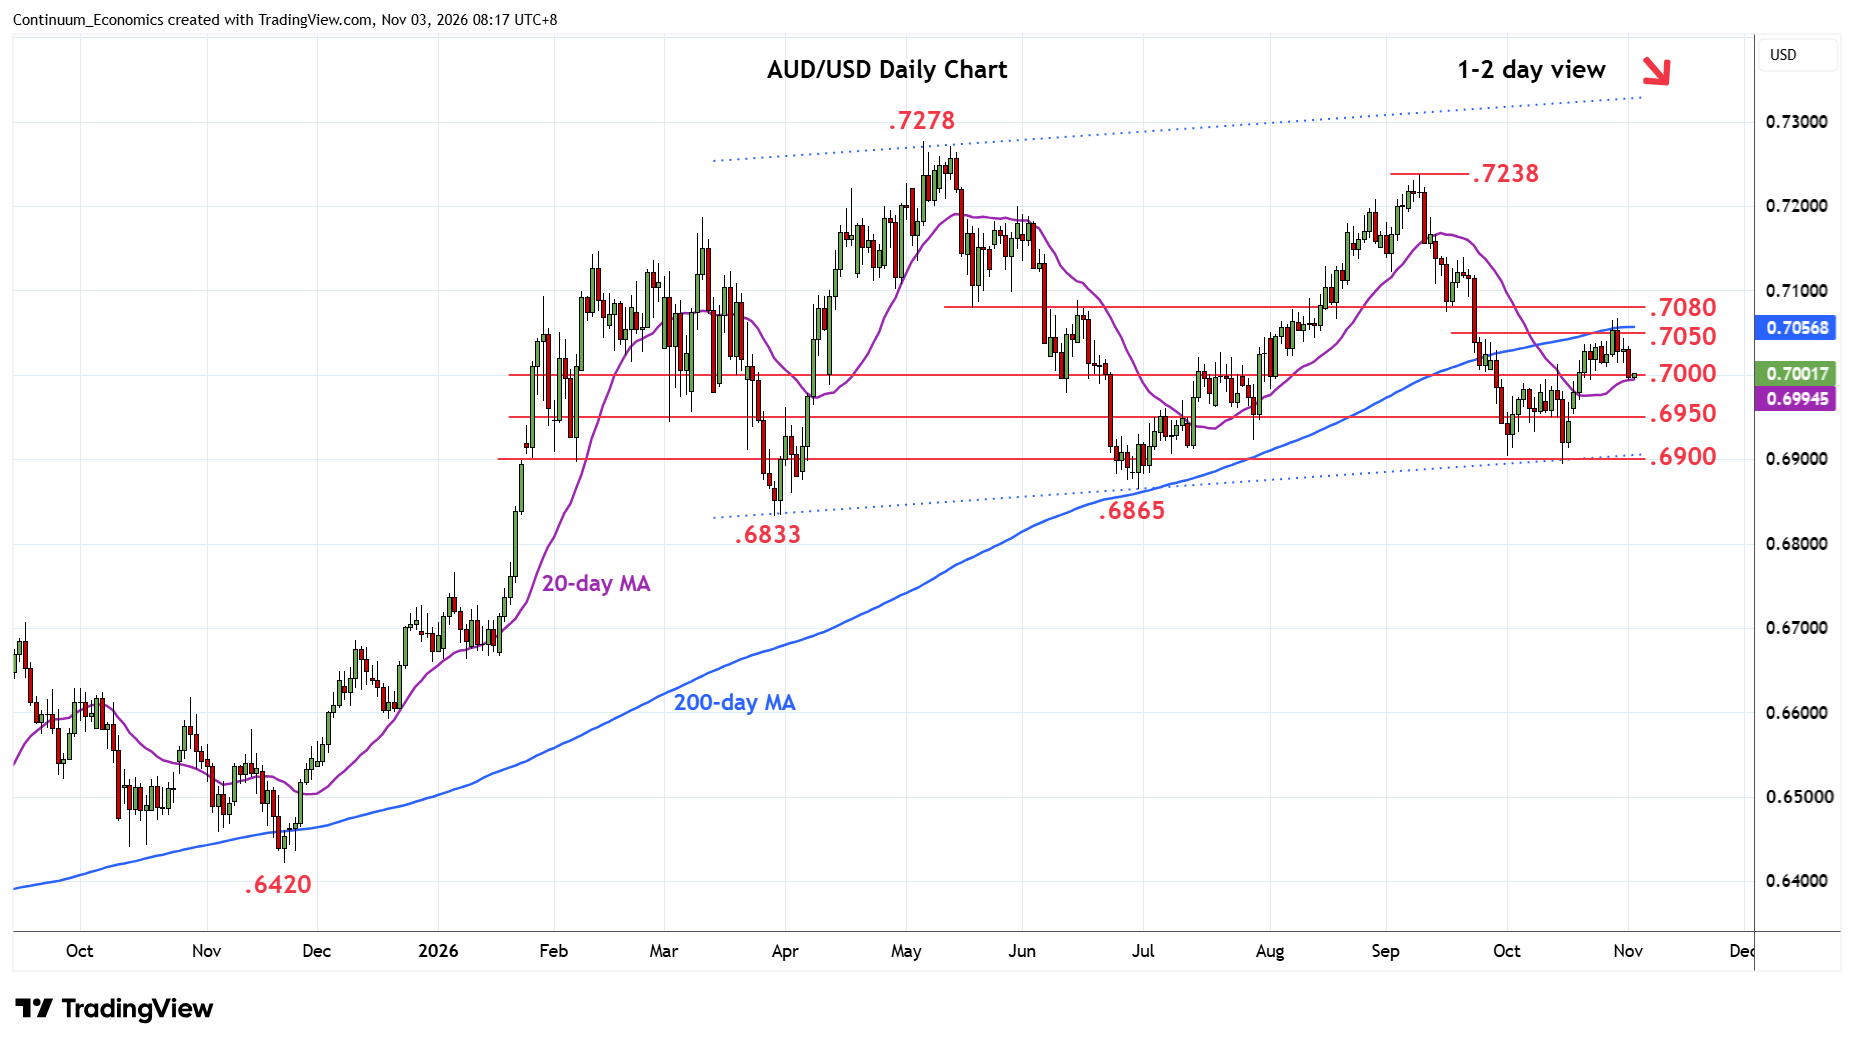
Under pressure, as prices extend pullback from the .7050/65 resistance to break the .7000 level
| Levels | Imp | Comment | Levels | Imp | Comment | |||
|---|---|---|---|---|---|---|---|---|
| R4 | 0.7140 | * | 21 Sep high | S1 | 0.6980 | * | congestion | |
| R3 | 0.7100/05 | * | congestion, 61.8% | S2 | 0.6950 | * | congestion | |
| R2 | 0.7080 | ** | May low, congestion | S3 | 0.6900 | ** | congestion, channel | |
| R1 | 0.7050/65 | * | congestion, 50% Sep/Oct fall | S4 | 0.6865 | ** | Jun low |
Asterisk denotes strength of level
00:20 GMT - Under pressure, as prices extend pullback from the .7050/65 resistance to break the .7000 level. Daily studies have turned lower to unwind overbought readings to open up room for extension to .6980 and .69850 congestion area. Would expect this area to underpin and give way to renewed buying interest later. Meanwhile, resistance remains at the .7050 congestion and break here and the .7065 Fibonacci level will see room to extend bullish gains from the .6900 October low to strong resistance at .7080/.7100, May low and congestion area.