Published: 2026-11-02T01:00:10.000Z
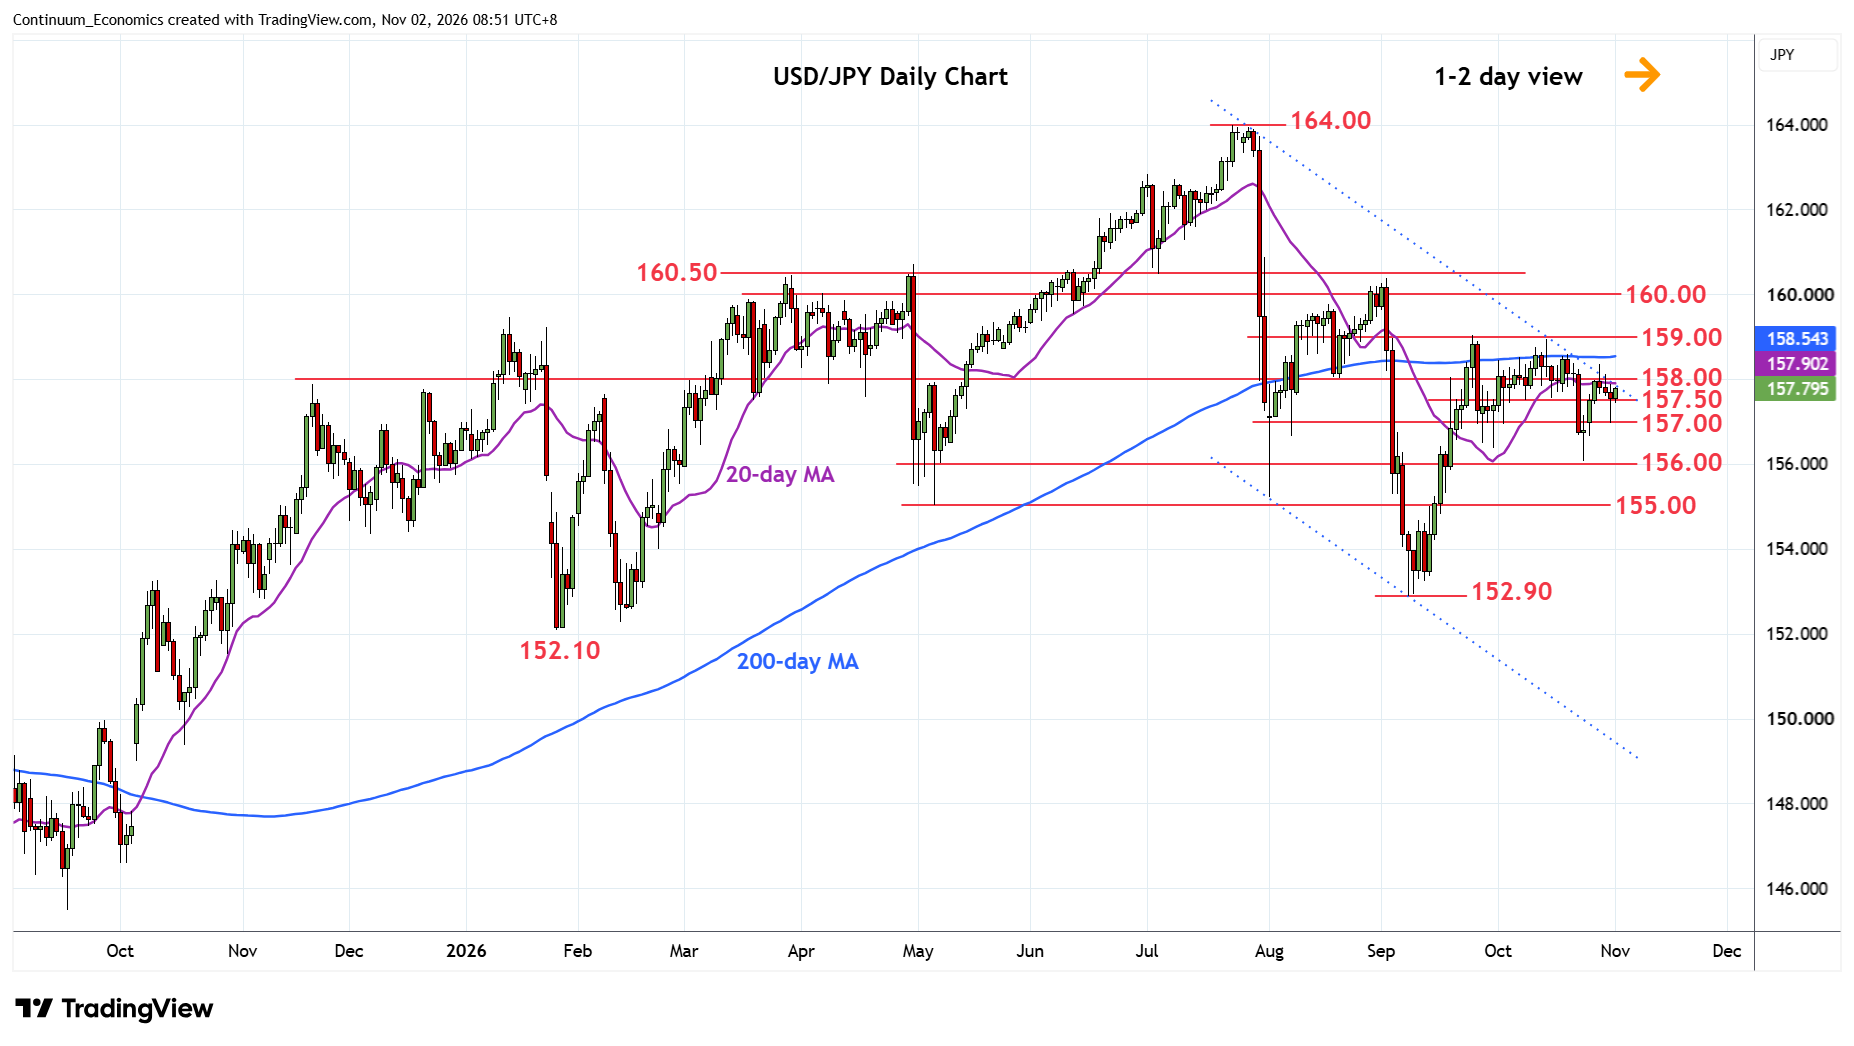
Chart USD/JPY Update: Back to the 158.00/157.50 range area
-
Bounce from the 157.00 level see prices back to consolidate within the 158.00/157.50 range
| Levels | Imp | Comment | Levels | Imp | Comment | |||
|---|---|---|---|---|---|---|---|---|
| R4 | 160.00 | ** | figure, congestion | S1 | 157.50/00 | * | congestion | |
| R3 | 159.00 | ** | congestion, 24 Sep high | S2 | 156.50 | * | congestion | |
| R2 | 158.50 | * | congestion, 200-day MA | S3 | 156.07/00 | ** | 23 Oct low, congestion | |
| R1 | 158.00 | ** | figure, congestion | S4 | 155.00 | ** | May low, congestion |
Asterisk denotes strength of level
00:50 GMT - Bounce from the 157.00 level see prices back to consolidate within the 158.00/157.50 range. Daily studies are mixed and suggest ranging action here likely to extend below the 158.00 level. Above the latter will see room for retest of resistance at the 158.50/159.00 congestion area and 24 September high which are expected to cap. Meanwhile, support remains at the 157.50/157.00 congestion. A later break here will return focus to the downside for retest of the 156.07 low and see scope for follow-through to retest strong support at the 155.00, May low.