Published: 2026-06-29T07:23:08.000Z
Chart AUD/NZD Update: Leaning lower in consolidation
3
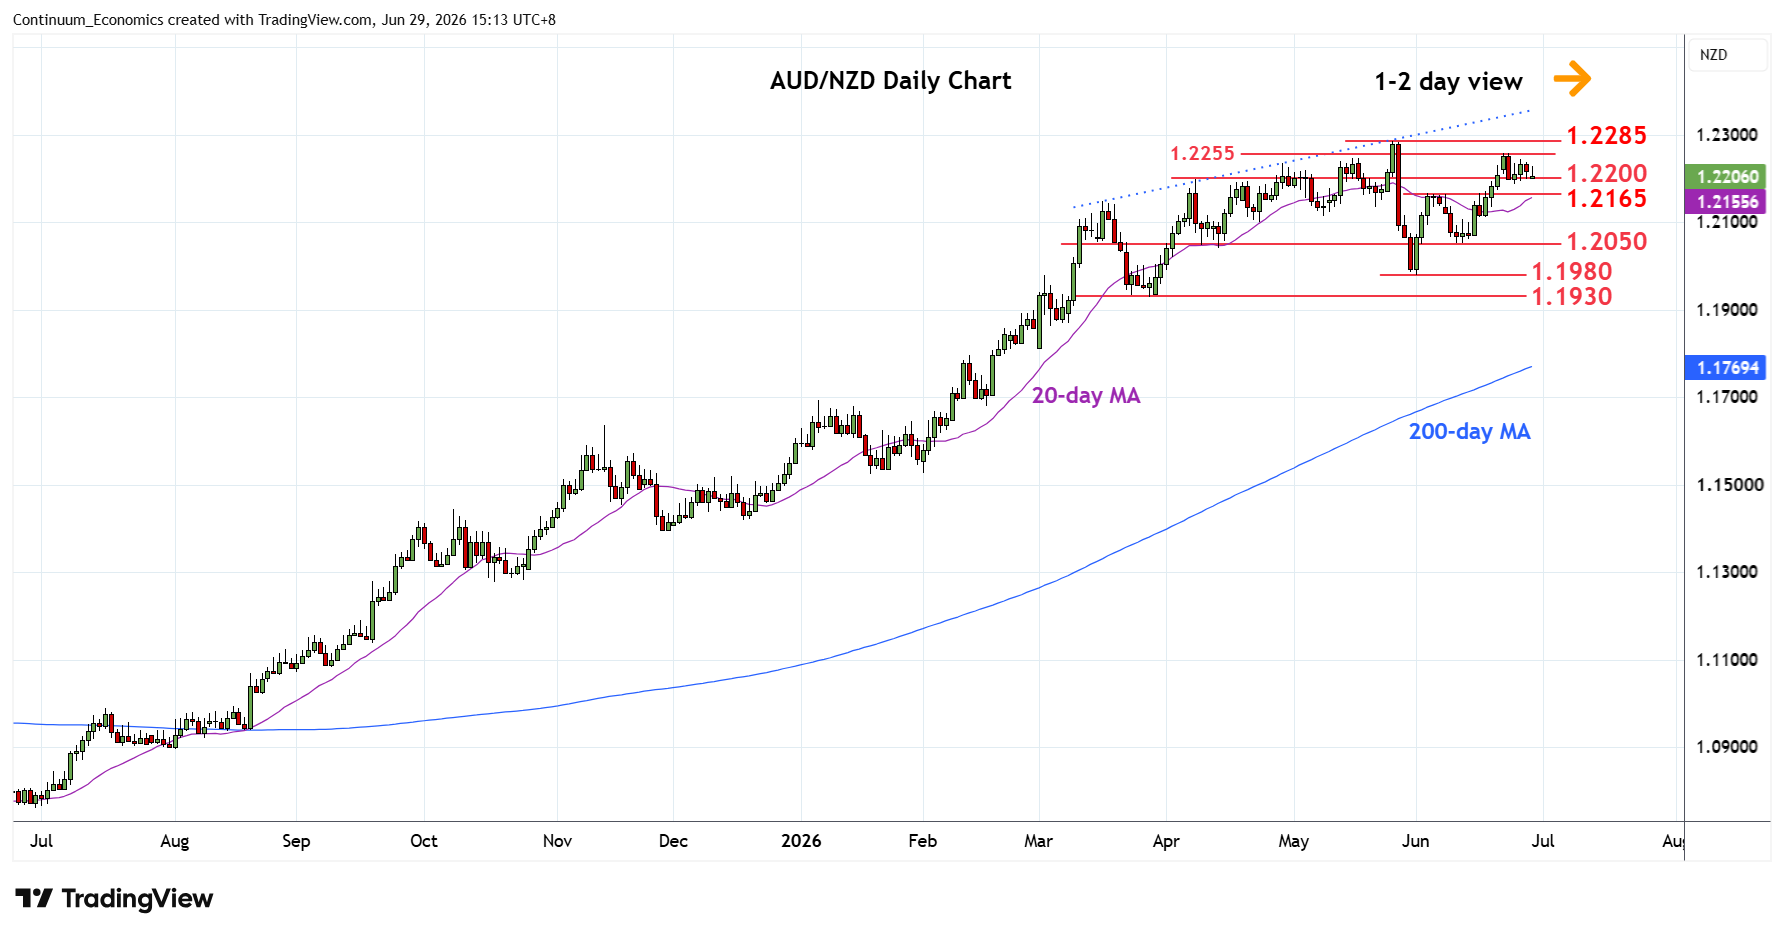
Leaning lower in consolidation from the 1.2255 high of last week
| Level | Comment | Level | Comment | |||||
|---|---|---|---|---|---|---|---|---|
| R4 | 1.2370 | * | 2012 year low | S1 | 1.2200 | * | congestion | |
| R3 | 1.2345 | * | 61.8% 2011/2020 fall | S2 | 1.2165/50 | * | 3 Jun high, congestion | |
| R2 | 1.2300 | * | congestion | S3 | 1.2100 | * | congestion | |
| R1 | 1.2285 | ** | 26 May YTD high | S4 | 1.2050 | ** | 10 Jun low |
Asterisk denotes strength of level
07:20 GMT - Leaning lower in consolidation from the 1.2255 high of last week with the resulting flag pattern suggesting scope for break here to extend gains from the 1.1980 low to retest the 1.2285 May current year high. Would expect reaction at the latter but a later break here cannot be ruled out to retrace the 2011/2020 fall to 1.2345, 61.8% Fibonacci retracement. Meanwhile, support remains at the 1.2200 congestion and this extend to the 1.2165/50 area. Would take break here to fade the upside pressure and see deeper pullback to support at 1.2100 congestion and 1.2050 low of 10 June.