Published: 2026-11-02T00:40:08.000Z
Chart NZD/USD Update: Consolidating above .5625/00 support
-
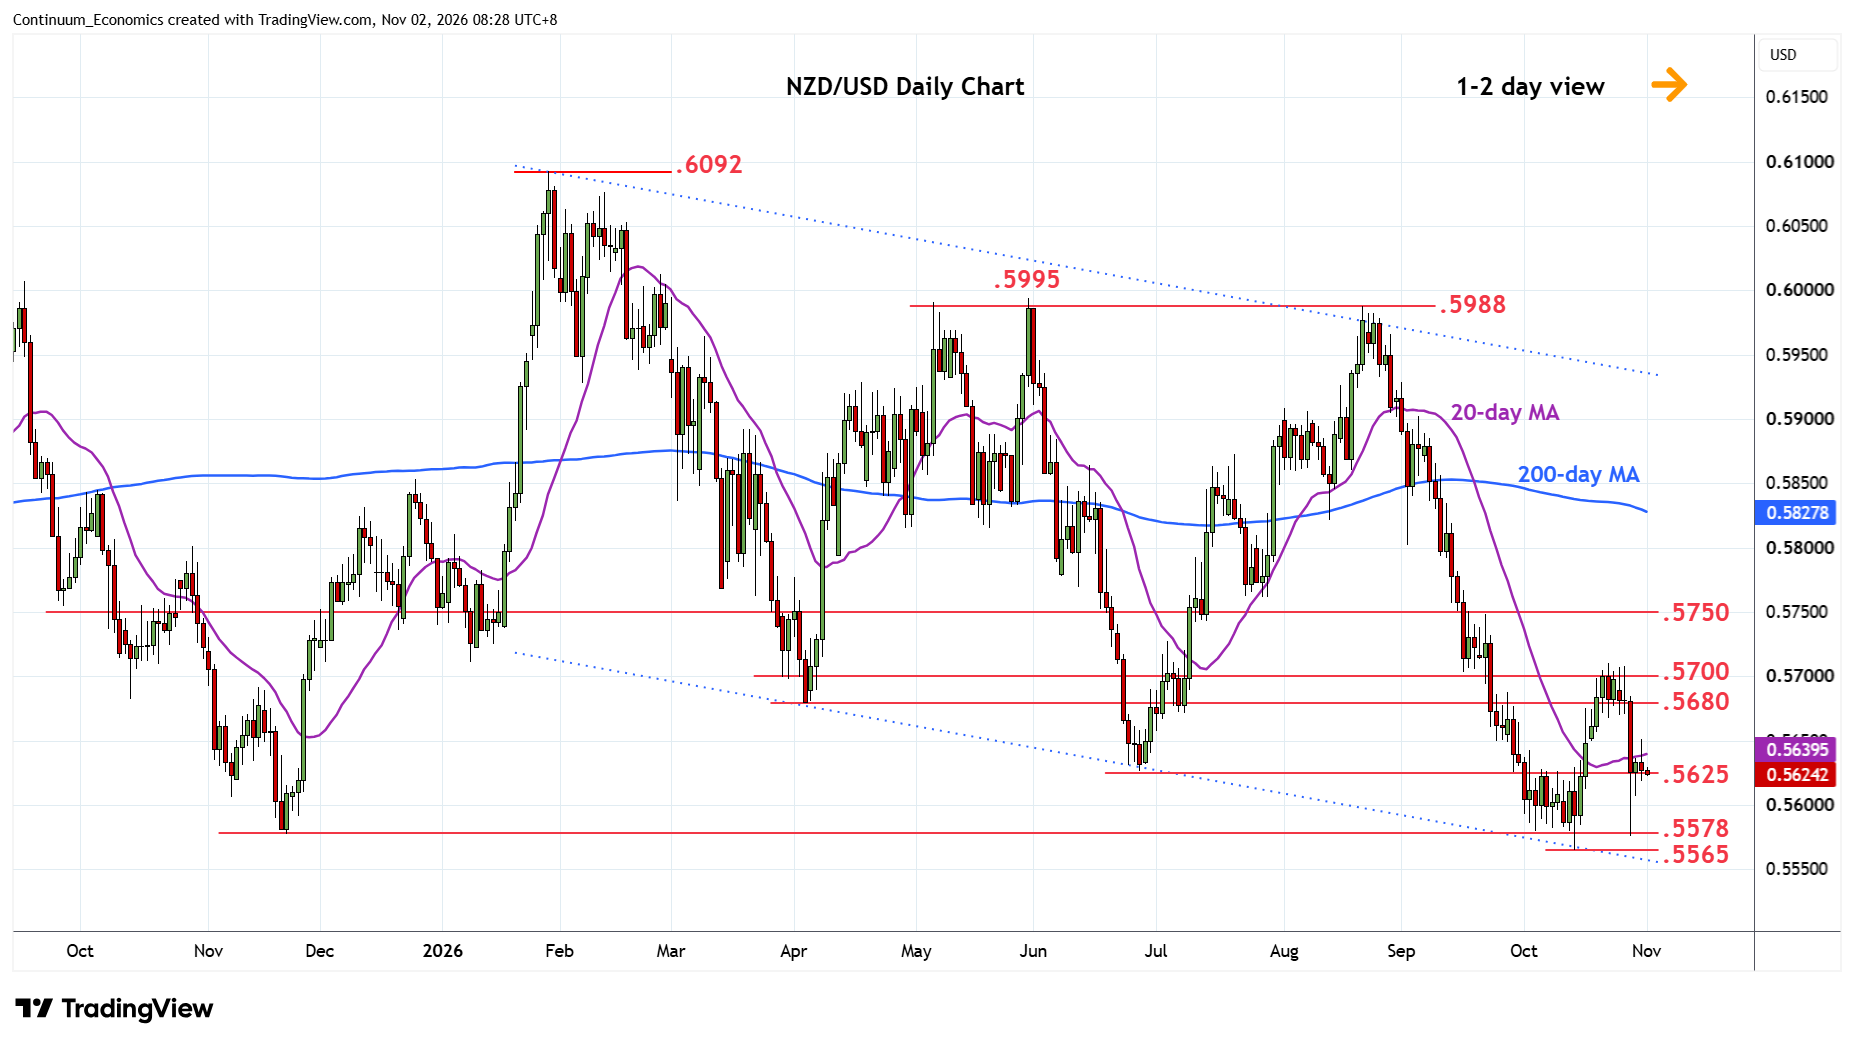
Little change, as prices extend consolidation around .5625 following strong bounce from the .5578 support
| Levels | Imp | Comment | Levels | Imp | Comment | |||
|---|---|---|---|---|---|---|---|---|
| R4 | .5750 | * | congestion | S1 | .5625/00 | * | Jun low, congestion | |
| R3 | .5700/10 | ** | congestion, 22 Oct high | S2 | .5578 | * | Nov 2025 low | |
| R2 | .5680 | * | Apr low | S3 | .5565 | ** | 14 Oct YTD low | |
| R1 | .5650 | * | congestion | S4 | .5512 | ** | Oct 2022 year low |
Asterisk denotes strength of level
00:30 GMT - Little change, as prices extend consolidation around .5625 following strong bounce from the .5578 support. However, the downside remains vulnerable and break of the .5600 level will expose the .5578 support and .5565 current year low to retest. Below these, if seen, will threaten extension of the broader losses from the July 2025 year high to strong support area at .5512 and extending to the .5485/.5470, 2025/2020 year lows. Meanwhile, resistance remains at .5650 congestion. Above here will fade the downside pressure and open up room for retest of .5680/.5710 resistance.