Published: 2026-10-09T06:14:46.000Z
Chart EUR/GBP Update: Turned up from .8448 current year low
1
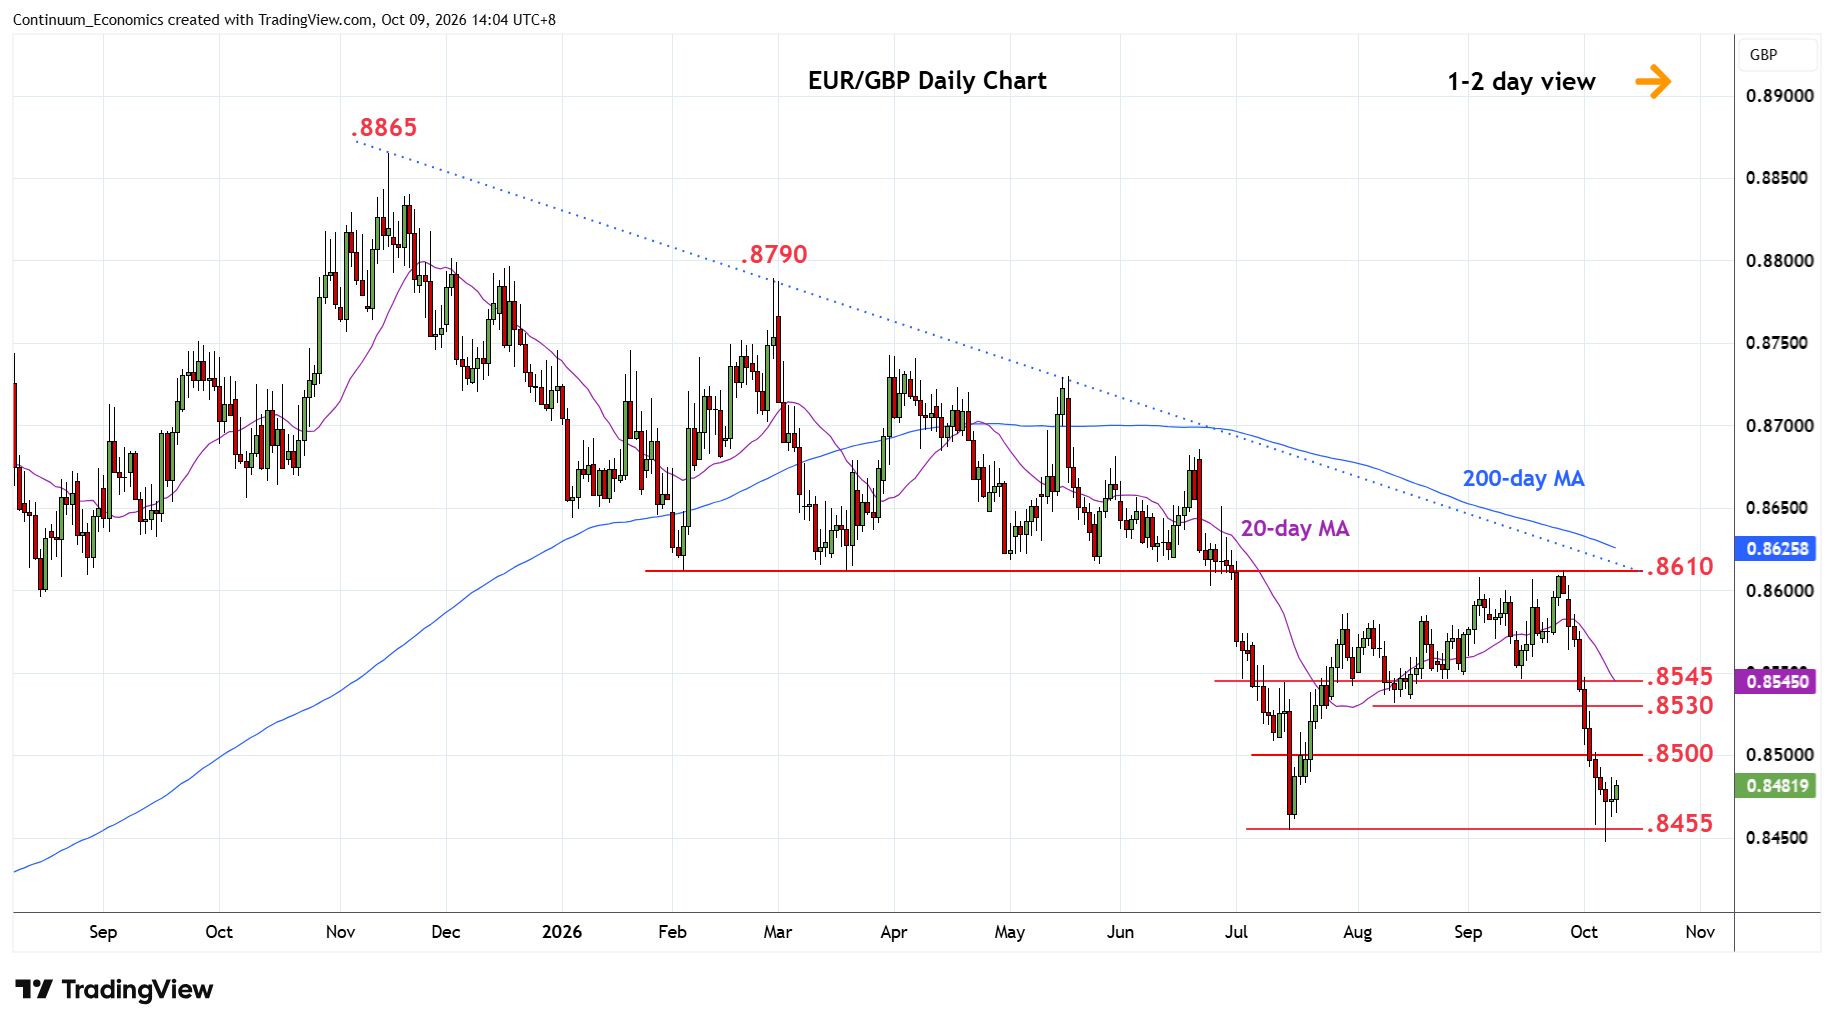
Edged up from the .8448 mid-week current year low as prices consolidate recent sharp losses from the .8610 September swing high
| Level | Comment | Level | Comment | |||||
|---|---|---|---|---|---|---|---|---|
| R4 | 0.8585 | * | Aug high | S1 | 0.8448 | ** | 7 Oct YTD low | |
| R3 | 0.8545 | ** | 15 Sep low | S2 | 0.8400 | * | congestion | |
| R2 | 0.8530 | * | Aug low | S3 | 0.8355 | * | May 2025 low | |
| R1 | 0.8500 | * | congestion | S4 | 0.8322 | * | Apr 2025 low |
Asterisk denotes strength of level
06:10 GMT - Edged up from the .8448 mid-week current year low as prices consolidate recent sharp losses from the .8610 September swing high. The intraday and daily studies have turned higher from oversold areas and suggest scope for stronger bounce the .8500 level. Close above here will ease the downside pressure and see room to strong resistance at the .8530/.8545 area which is expected to cap. Corrective gains are expected to give way to fresh selling pressure later. Below the .8455/.8448 lows will see room to the .8400 level then the .8355/.8322, May/April 2025 lows.