Chart USD/ZAR Update: Choppy trade
Cautious trade around 16.6000 has given way to anticipated tests lower
| Level | Comment | Level | Comment | |||||
|---|---|---|---|---|---|---|---|---|
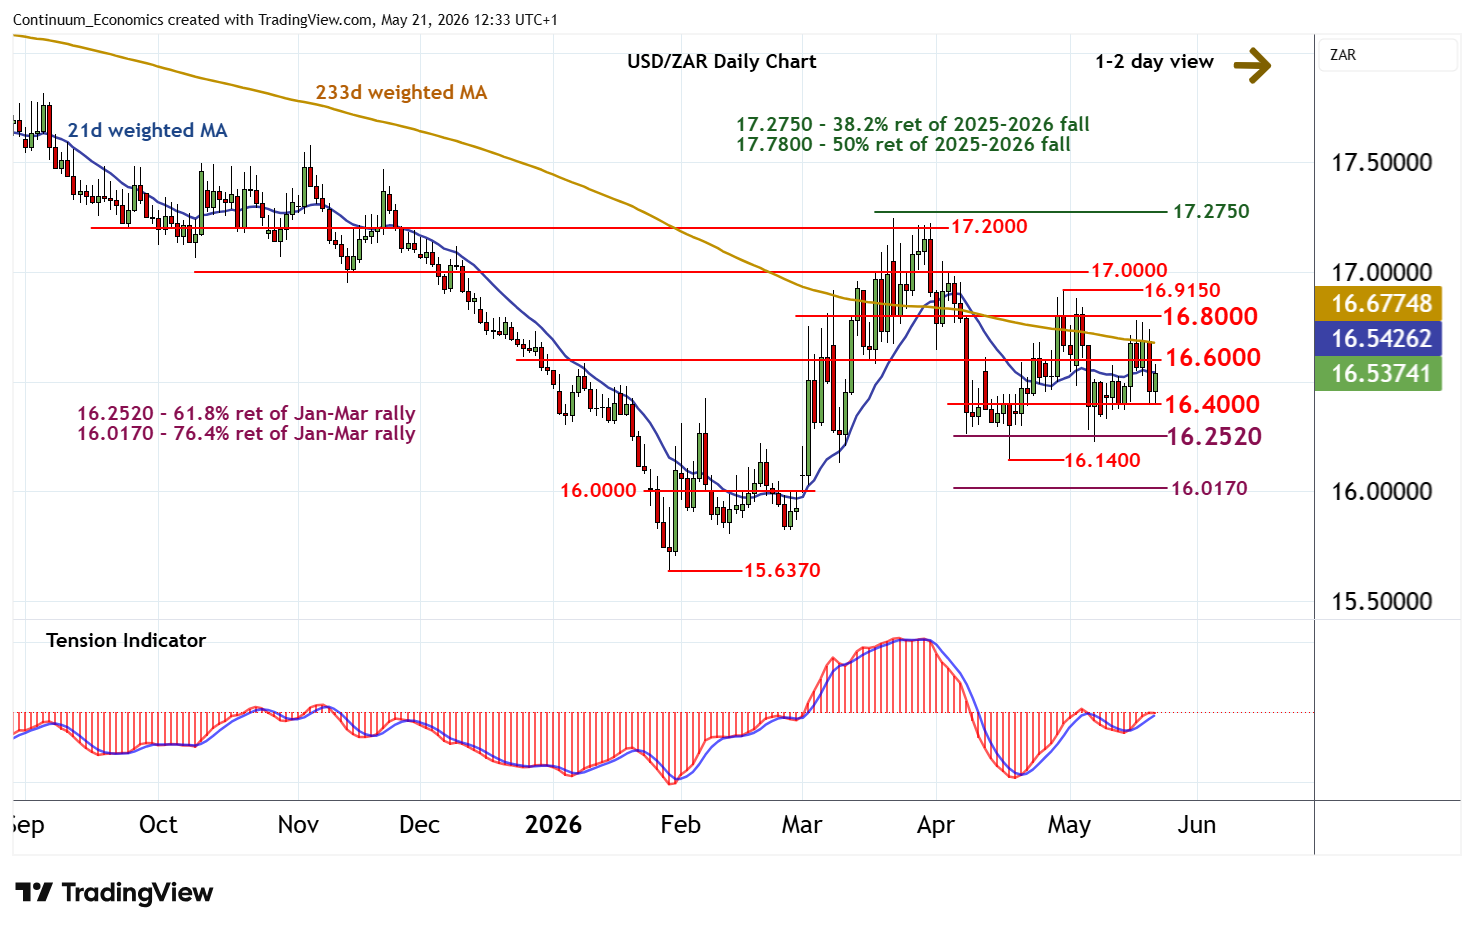
| R4 | 17.0000 | * | congestion | S1 | 16.4000 | congestion | ||
| R3 | 16.9150 | ** | 30 Apr (w) high | S2 | 16.2520 | ** | 61.8% ret of Jan-Mar rally | |
| R2 | 16.8000 | * | congestion | S3 | 16.1400 | ** | 17 Apr (m) low | |
| R1 | 16.6000 | * | congestion | S4 | 16.0170 | ** | 76.4% ret of Jan-Mar rally |
Asterisk denotes strength of level
12:15 BST - Cautious trade around 16.6000 has given way to anticipated tests lower, with prices reachinig congestion support at 16.4000 before bouncing above 16.5000. Daily studies are mixed/negative and broader weekly charts are coming under pressure, highlighting room for further losses in the coming sessions. A break below 16.4000 will open up strong support at the 16.2520 Fibonacci retracement. But any immediate tests beneath here should give way to fresh consolidation above the 16.1400 monthly low of 17 April. Meanwhile, resistance remains up to congestion around 16.6000. A close above here would open up 16.8000, where fresh consolidation is expected to appear.