Published: 2026-06-09T00:35:58.000Z
Chart NZD/USD Update: Consolidating at .5800 level
1
Consolidating at the .5800 level after bounce attempt from the .5778 low was checked at the .5815/.5835 May lows and 200-day MA
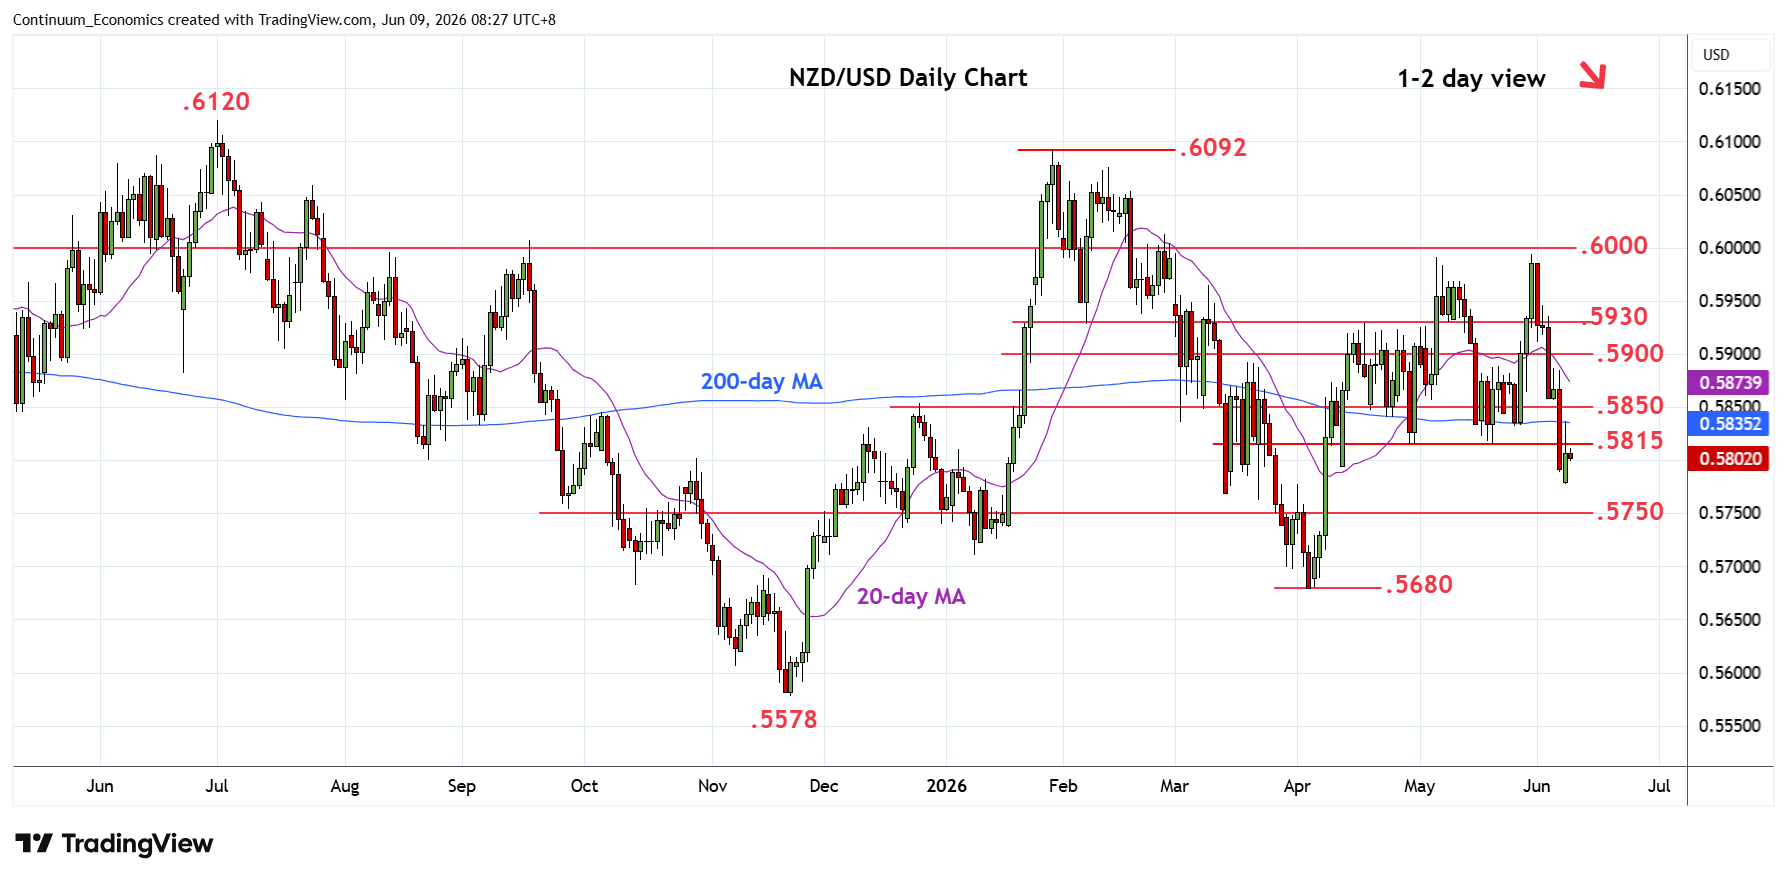
| Levels | Imp | Comment | Levels | Imp | Comment | |||
|---|---|---|---|---|---|---|---|---|
| R4 | .5930 | ** | Feb low | S1 | .5778 | * | 8 Jun low | |
| R3 | .5900 | * | congestion | S2 | .5750 | * | congestion | |
| R2 | .5850 | * | congestion | S3 | .5700 | * | Mar low, congestion | |
| R1 | .5815/35 | ** | May low, 200-day MA | S4 | .5680 | ** | Apr low |
Asterisk denotes strength of level
00:30 GMT - Consolidating at the .5800 level after bounce attempt from the .5778 low was checked at the .5815/.5835 May lows and 200-day MA. Negative daily and weekly studies suggest consolidation giving way to renewed selling pressure later and lower will see room to the .5750 congestion. Below this will see potential to retest the .5700/.5680, March and April lows. Meanwhile, resistance at the .5815/35 area is expected to cap and keep pressure on the downside. Regaining this needed to ease the downside pressure and see room for stronger bounce.