Published: 2026-11-20T00:57:18.000Z
Chart USD/JPY Update: Ranging within 159.00/160.00 area
1
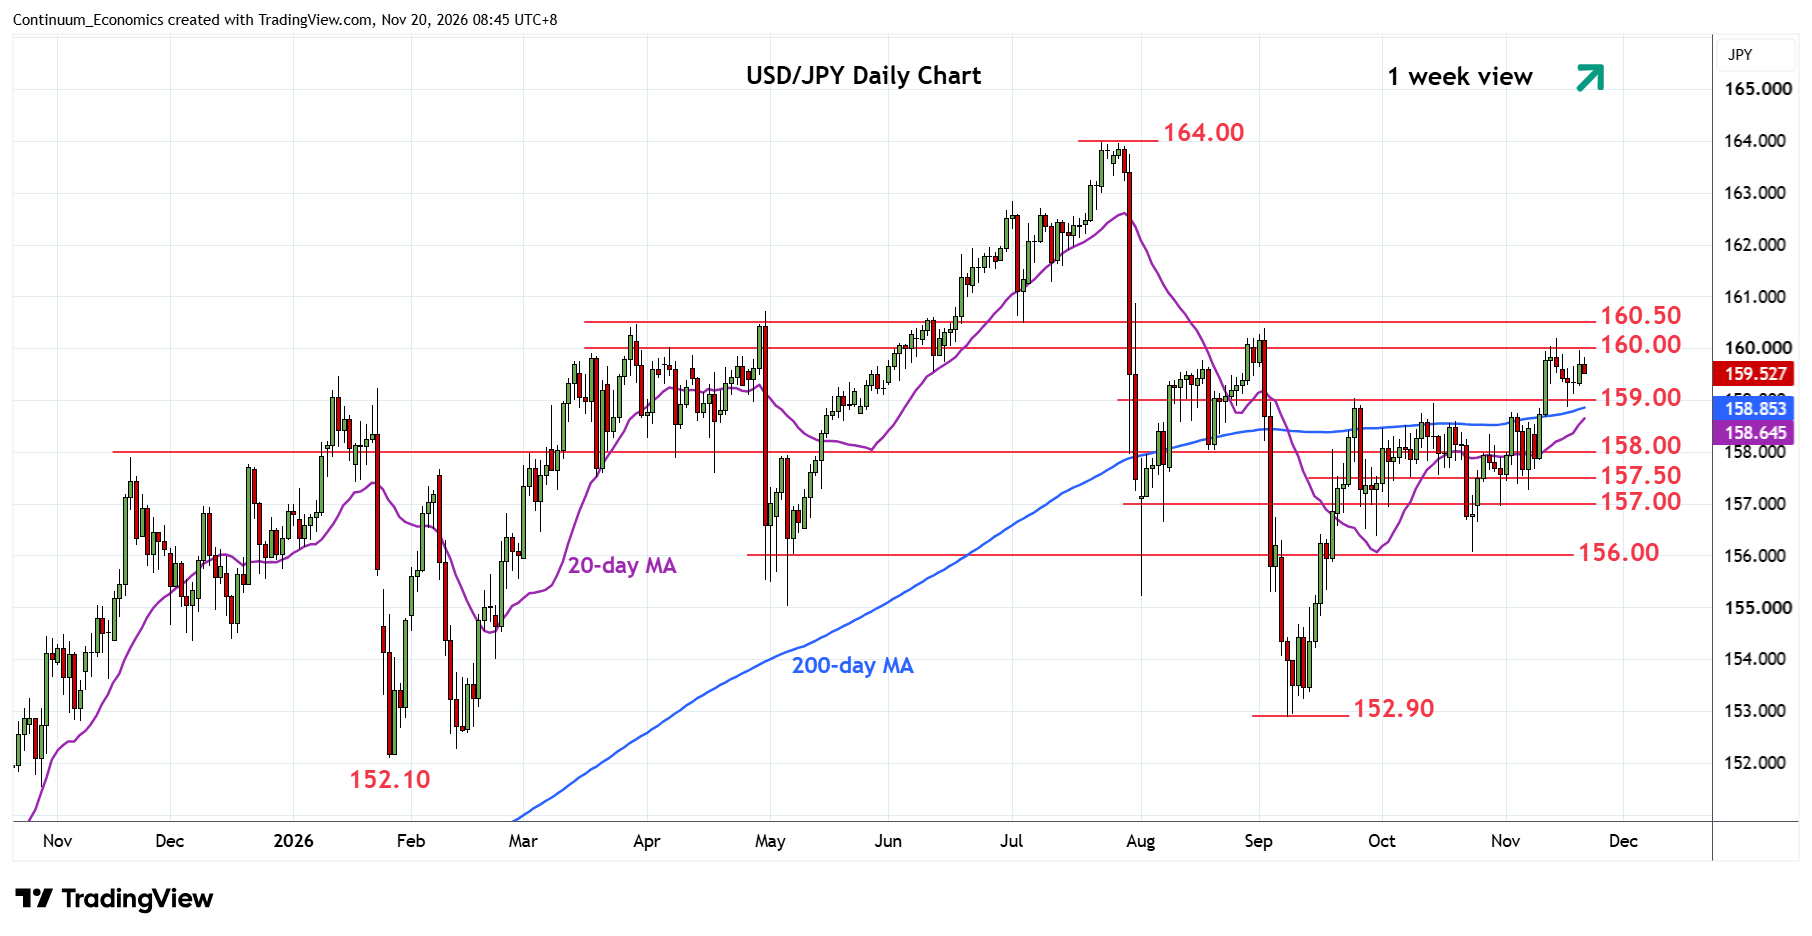
Consolidation at 159.50 gave way to bounce to retest the 160.00 before settling back to extend ranging action within the 160.00/159.00 area
| Levels | Imp | Comment | Levels | Imp | Comment | |||
|---|---|---|---|---|---|---|---|---|
| R4 | 161.95 | ** | Jul 2024 year high | S1 | 159.00 | ** | congestion | |
| R3 | 161.00 | * | figure, congestion | S2 | 158.77 | * | 3 Nov high | |
| R2 | 160.40/50 | * | Sep high, congestion | S3 | 158.00 | * | congestion | |
| R1 | 160.00 | ** | figure, congestion | S4 | 157.50/00 | * | congestion |
Asterisk denotes strength of level
00:50 GMT - Consolidation at 159.50 gave way to bounce to retest the 160.00 before settling back to extend ranging action within the 160.00/159.00 area. However, hold above the 159.00/158.77 support keep bullish bias from the 156.07 September low in focus. Break above the 160.00 level, if seen, will see scope to resistance at the 160.40/50 September high and congestion area which is expected to cap. Meanwhile, support remains at the 159.00/158.77 previous highs. Would take break here to see pullback to support at the 158.00/157.00 congestion area.