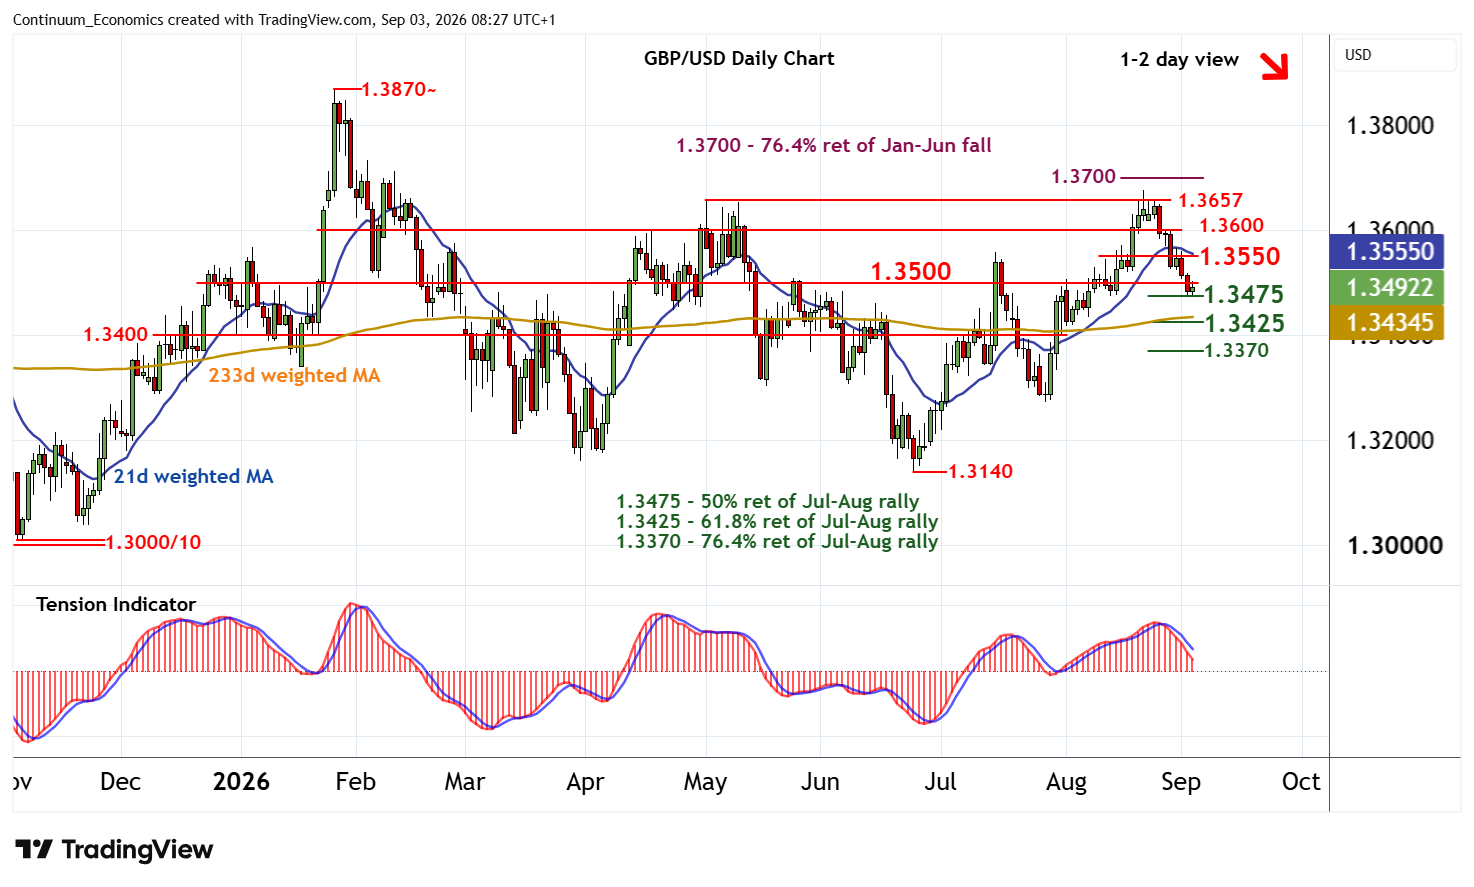
Chart GBP/USD Update: Reached the 1.3475 Fibonacci retracement - studies under pressure
Anticipated losses have reached support at the 1.3475 Fibonacci retracement
| Level | Comment | Level | Comment | |||||
|---|---|---|---|---|---|---|---|---|
| R4 | 1.3657 | ** | 1 May (m) high | S1 | 1.3475 | ** | 50% ret of Jul-Aug rally | |
| R3 | 1.3600 | ** | congestion | S2 | 1.3425 | ** | 61.8% ret of Jul-Aug rally | |
| R2 | 1.3550 | * | congestion | S3 | 1.3400 | ** | congestion | |
| R1 | 1.3500 | * | congestion | S4 | 1.3370 | ** | 76.4% ret of Jul-Aug rally |
Asterisk denotes strength of level
08:10 BST - Anticipated losses have reached support at the 1.3475 Fibonacci retracement, where rising intraday studies are prompting short-term reactions. Immediate focus is on congestion resistance at 1.3500. But daily studies remain under pressure and positive weekly charts are flattening, suggesting any break should be limited in renewed selling interest/consolidation beneath further congestion around 1.3550.
Following cautious trade, fresh losses are looked for. A later close below 1.3475 will add weight to sentiment and extend late-August losses towards congestion around 1.3400 and the 1.3425 retracement. Already oversold daily stochastics could limit any initial tests in short-covering/consolidation.