Published: 2026-09-01T08:27:59.000Z
Chart USD Index DXY Update: Choppy trade - studies turning higher
9
The anticipated break above 99.50 has been pushed back from 99.71
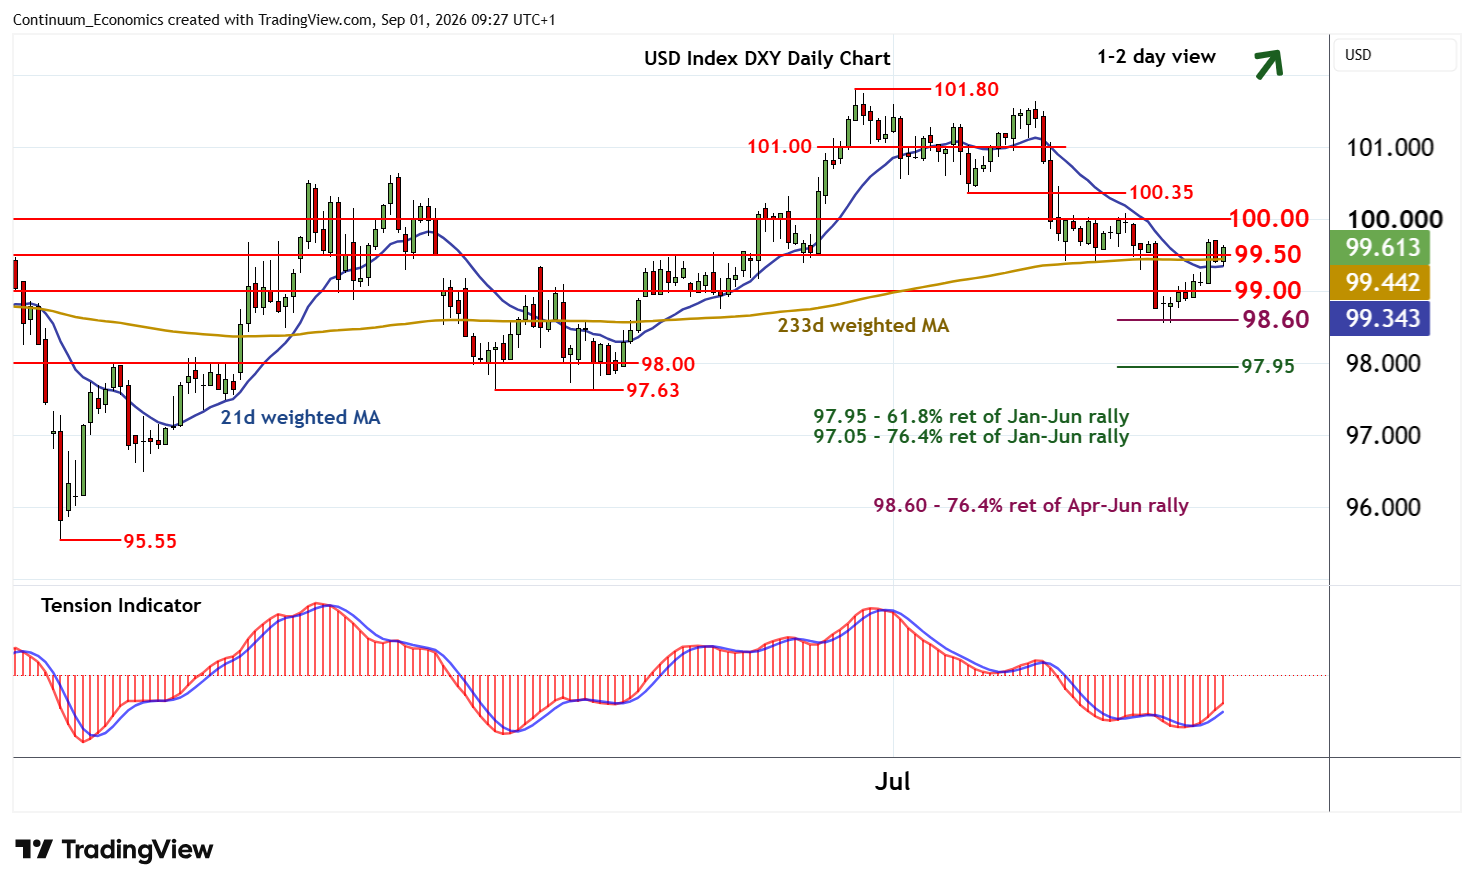
| Levels | Imp | Comment | Levels | Imp | Comment | |||
|---|---|---|---|---|---|---|---|---|
| R4 | 100.35 | * | 15 Jul (w) low | S1 | 99.00 | ** | congestion | |
| R3 | 100.00 | ** | congestion | S2 | 98.60 | ** | 76.4% ret of Apr-Jun rally | |
| R2 | 99.71 | 31 Aug (w) high | S3 | 97.95/00 | ** | 61.8% ret; congestion | ||
| R1 | 99.50 | ** | congestion | S4 | 97.63 | ** | Apr-May lows |
Asterisk denotes strength of level
09:10 BST - The anticipated break above 99.50 has been pushed back from 99.71, with prices once again trading around 99.50. Daily stochastics and the daily Tension Indicator continue to rise, and oversold weekly stochastics are turning higher, suggesting room for fresh gains in the coming sessions. Focus is expected to turn back to congestion resistance at 100.00. But already overbought daily stochastics could limit any initial tests in consolidation.
Meanwhile, congestion support at 99.00 should underpin any immediate setbacks.