Chart USD/RUB Update: Limited tests higher
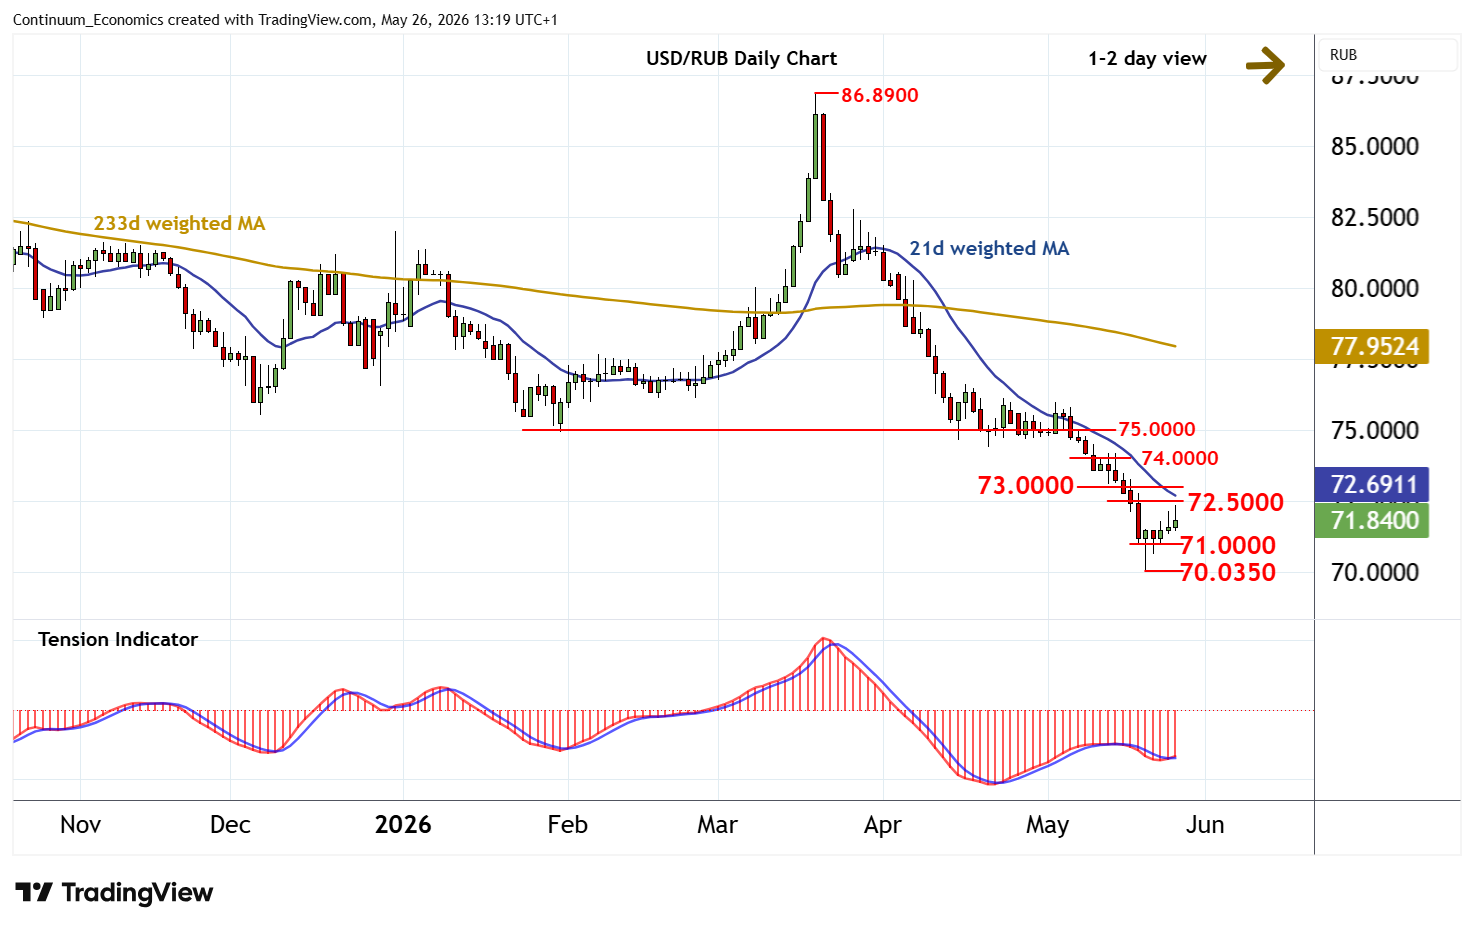
The bounce from the 70.0350 current year low of 20 May has reached 72.0000
| Levels | Comment | Levels | Comment | |||||
| R4 | 75.0000 | ** | congestion | S1 | 71.0000 | * | congestion | |
| R3 | 74.0000 | * | congestion | S2 | 70.0350 | ** | 20 May YTD low | |
| R2 | 73.0000 | * | break level | S3 | 70.0000 | ** | historic congestion | |
| R1 | 72.5000 | * | break level | S4 | 69.0200 | * | February 2023 low |
Asterisk denotes strength of level
12:30 BST - The bounce from the 70.0350 current year low of 20 May has reached 72.0000, where fresh consolidation is developing. Daily readings are rising, highlighting room for continuation towards resistance within the 72.5000 - 73.000 range. But mixed/negative daily readings and deteriorating longer-term charts should limit any continuation beyond here in renewed selling interest towards 74.0000. Following cautious/corrective trade, fresh losses are looked for. Support is raised to congestion around 71.0000. But a close below 70.0350 will add weight to sentiment and extend November 2024 losses below 70.0000 towards the 69.0200 low of February 2023.