Chart USD Index DXY Update: Cautious trade - studies rising
The anticipated push towards resistance at the 100.60 Fibonacci retracement is giving way to fresh consolidation
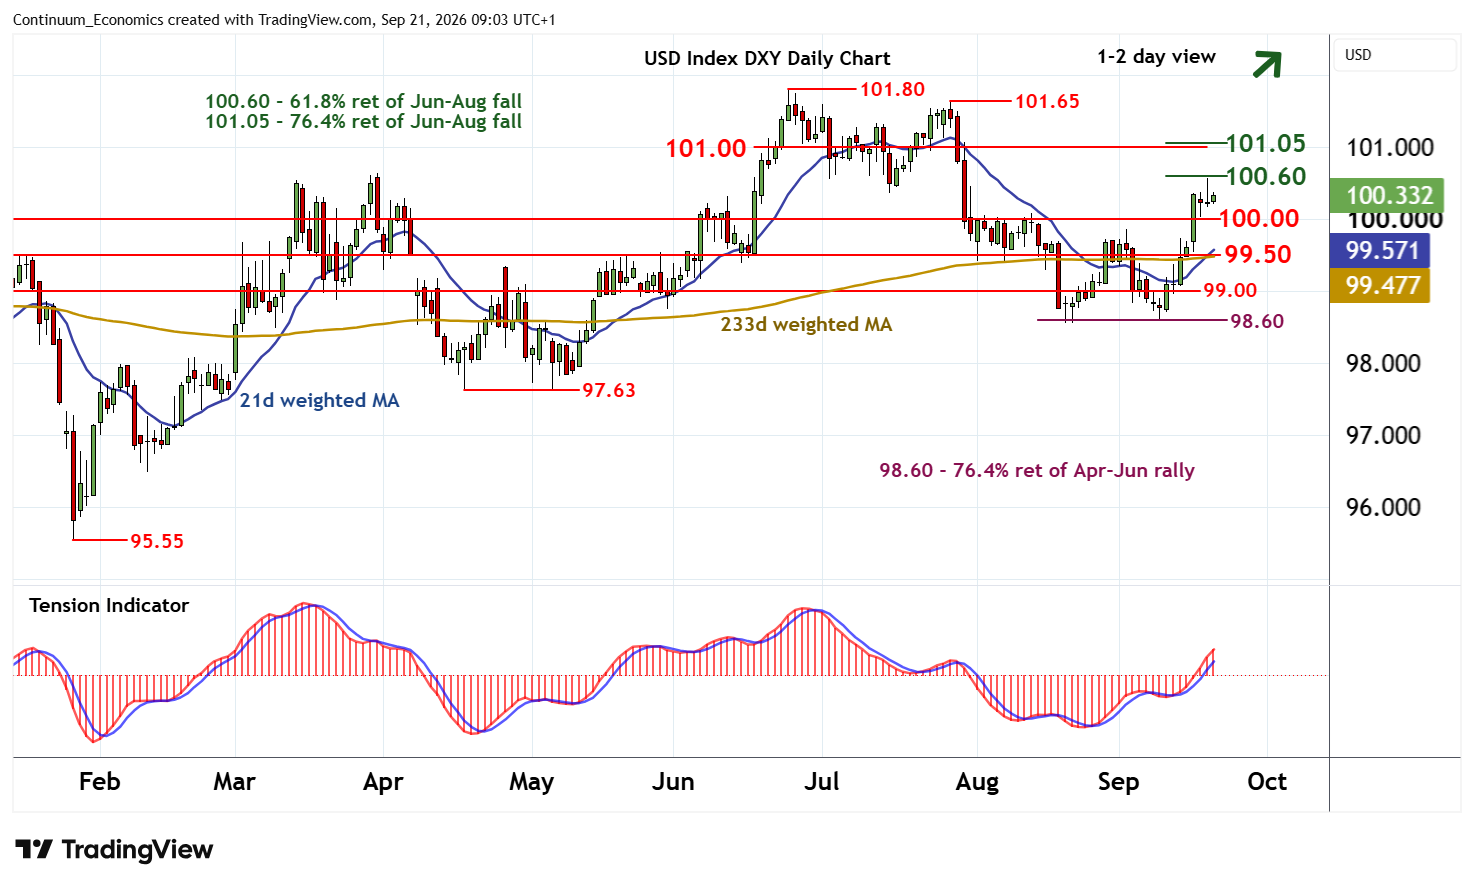
| Levels | Imp | Comment | Levels | Imp | Comment | |||
|---|---|---|---|---|---|---|---|---|
| R4 | 101.80 | ** | 24 Jun YTD high | S1 | 100.00 | ** | congestion | |
| R3 | 101.65 | ** | 28 Jul (m) high | S2 | 99.50 | * | congestion | |
| R2 | 101.00/05 | ** | congestion; 76.4% ret | S3 | 99.00 | ** | congestion | |
| R1 | 100.60 | ** | 61.8% ret of Jun-Aug fall | S4 | 98.60 | ** | 76.4% ret of Apr-Jun rally |
Asterisk denotes strength of level
08:45 BST - The anticipated push towards resistance at the 100.60 Fibonacci retracement is giving way to fresh consolidation, as intraday studies remain mixed, with prices currently balanced around 100.35. Overbought daily stochastics are edging lower, suggesting room for further range trade, before the positive daily Tension Indicator and improving weekly charts prompt further gains. A later break above 100.60 will improve sentiment and extend late-August gains towards strong resistance at congestion around 101.00 and the 101.05 Fibonacci retracement. However, already overbought daily stochastics could prompt fresh profit-taking towards here.
Meanwhile, support remains at congestion around 100.00. A close beneath here, if seen, will help to stabilise sentiment and prompt consolidation above further congestion around 99.50.