Published: 2026-06-24T00:31:42.000Z
Chart AUD/USD Update: Just shy of .6900 support
3
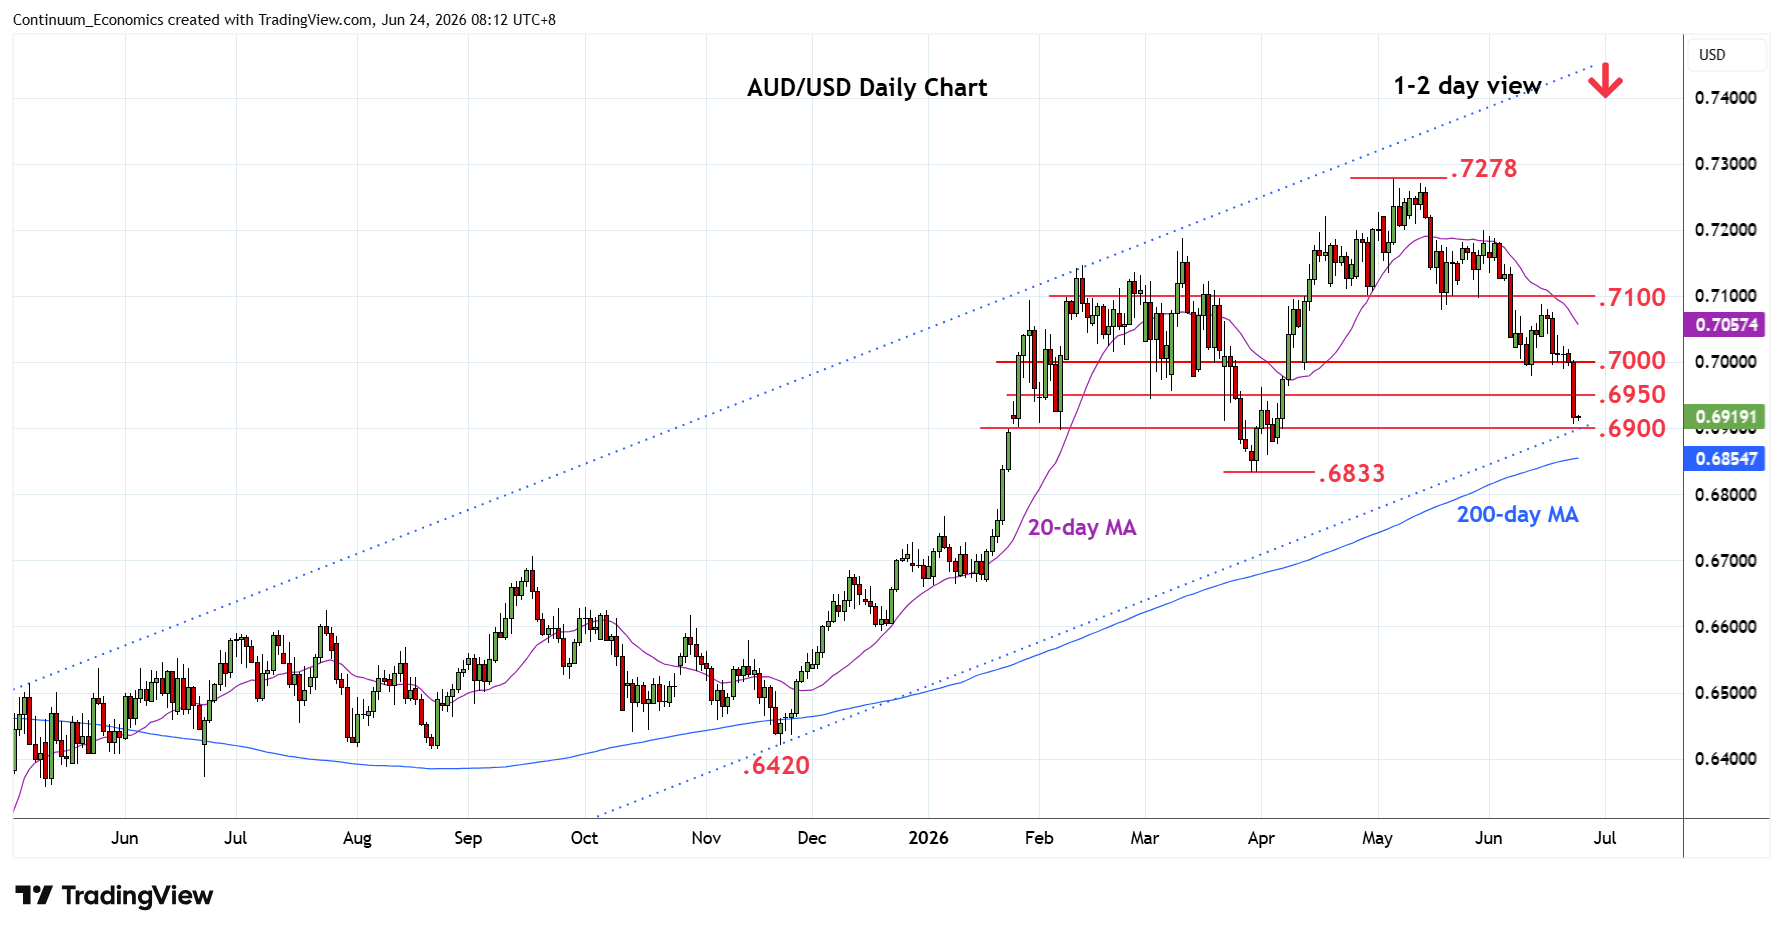
Sharply lower following break of support at .7000/.6980 low with losses reaching .6907
| Levels | Imp | Comment | Levels | Imp | Comment | |||
|---|---|---|---|---|---|---|---|---|
| R4 | 0.7080/00 | ** | May low, congestion | S1 | 0.6900 | ** | congestion, channel | |
| R3 | 0.7050 | * | congestion | S2 | 0.6833 | ** | Mar low | |
| R2 | 0.7000 | ** | congestion | S3 | 0.6800 | congestion | ||
| R1 | 0.6950 | * | congestion | S4 | 0.6755 | * | 38.2% 2025/2026 rally |
Asterisk denotes strength of level
00:15 GMT - Sharply lower following break of support at .7000/.6980 low with losses reaching .6907. Consolidation here see prices unwinding oversold intraday studies but a later break lower cannot be ruled out. Nearby see bullish channel support from April 2025 low coming into play at the .6900 congestion. Would take break here to see deeper pullback to retest the .6833 May low. Meanwhile, resistance is lower to .6950 and this extend to .6980/.7000 congestion area which is expected to limit immediate corrective bounce.