Weekly Chart EUR/USD Update: Balanced above fresh year low - studies remain under pressure
The anticipated continuation of losses from the 1.1710~ monthly high of 20 August has posted a fresh year low at 1.1155~
The anticipated continuation of losses from the 1.1710~ monthly high of 20 August has posted a fresh year low at 1.1155~, where unwinding oversold daily studies are prompting short-term reactions.
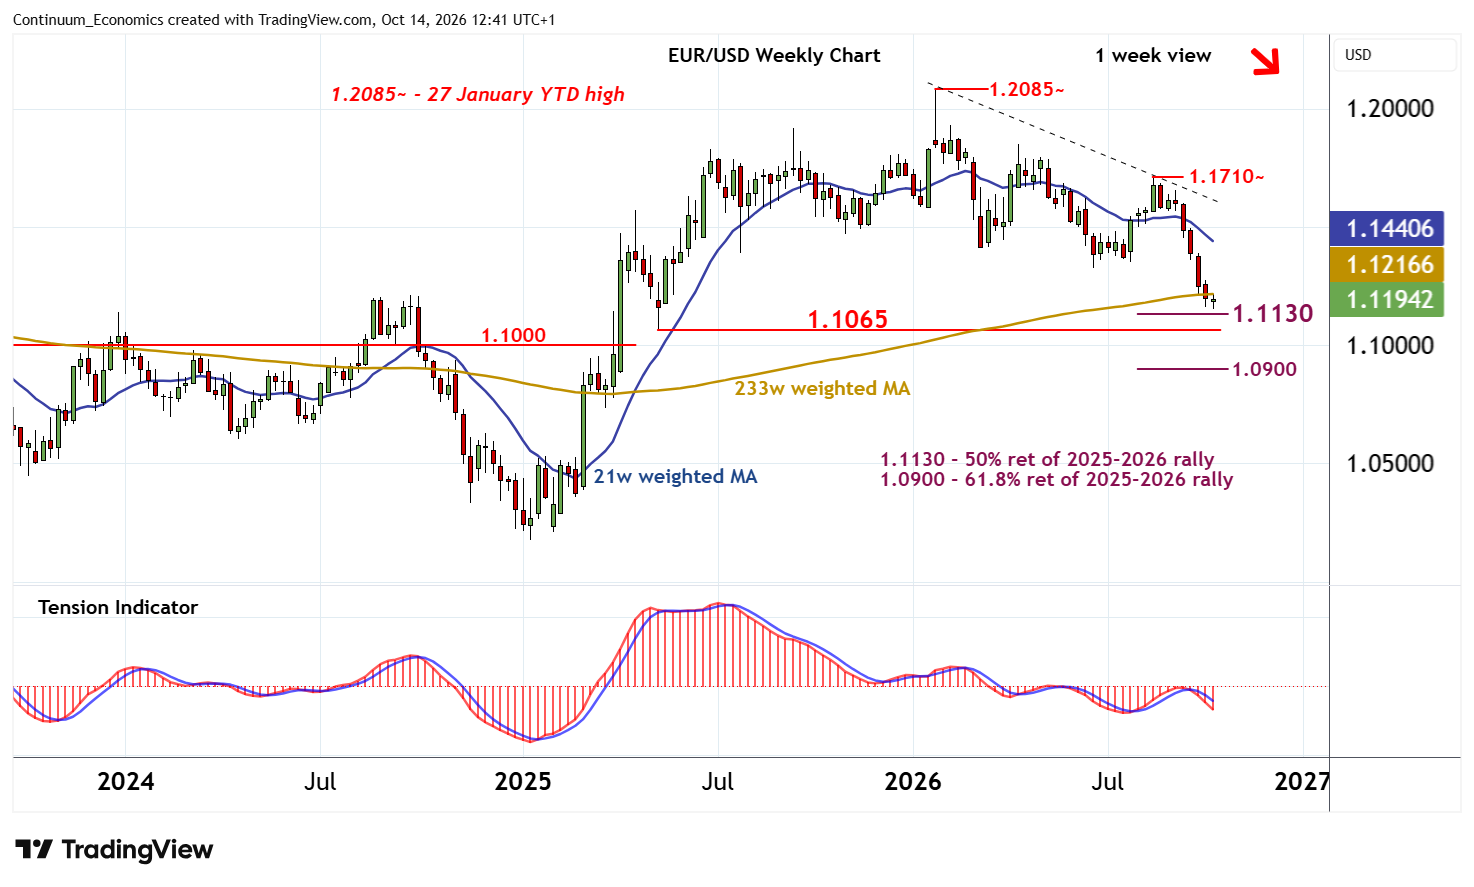
Weekly stochastics and the weekly Tension Indicator continue to track lower, however, highlighting a broadly bearish tone and room for still deeper losses in the coming sessions.
Strong support is at the 1.1130 Fibonacci retracement. A later break beneath here will add weight to sentiment and extend losses from the 1.2085 current year high of 27 January towards the 1.1065 low of May 2025. Already oversold weekly stochastics could limit any initial tests in short-covering/consolidation, before January losses resume and congestion support at 1.1000 attracts.
Meanwhile, resistance is at Focus will turn to congestion around 1.1250. Continuation down to the 1.1130 retracement cannot be ruled out, but by-then oversold weekly stochastics could limit any initial tests in short-covering/consolidation, before mixed/negative longer-term charts prompt still further losses.
Meanwhile, daily price action is unfolding in a descending wedge, (bearish continuation), pattern, with resistance up to congestion around 1.1250.
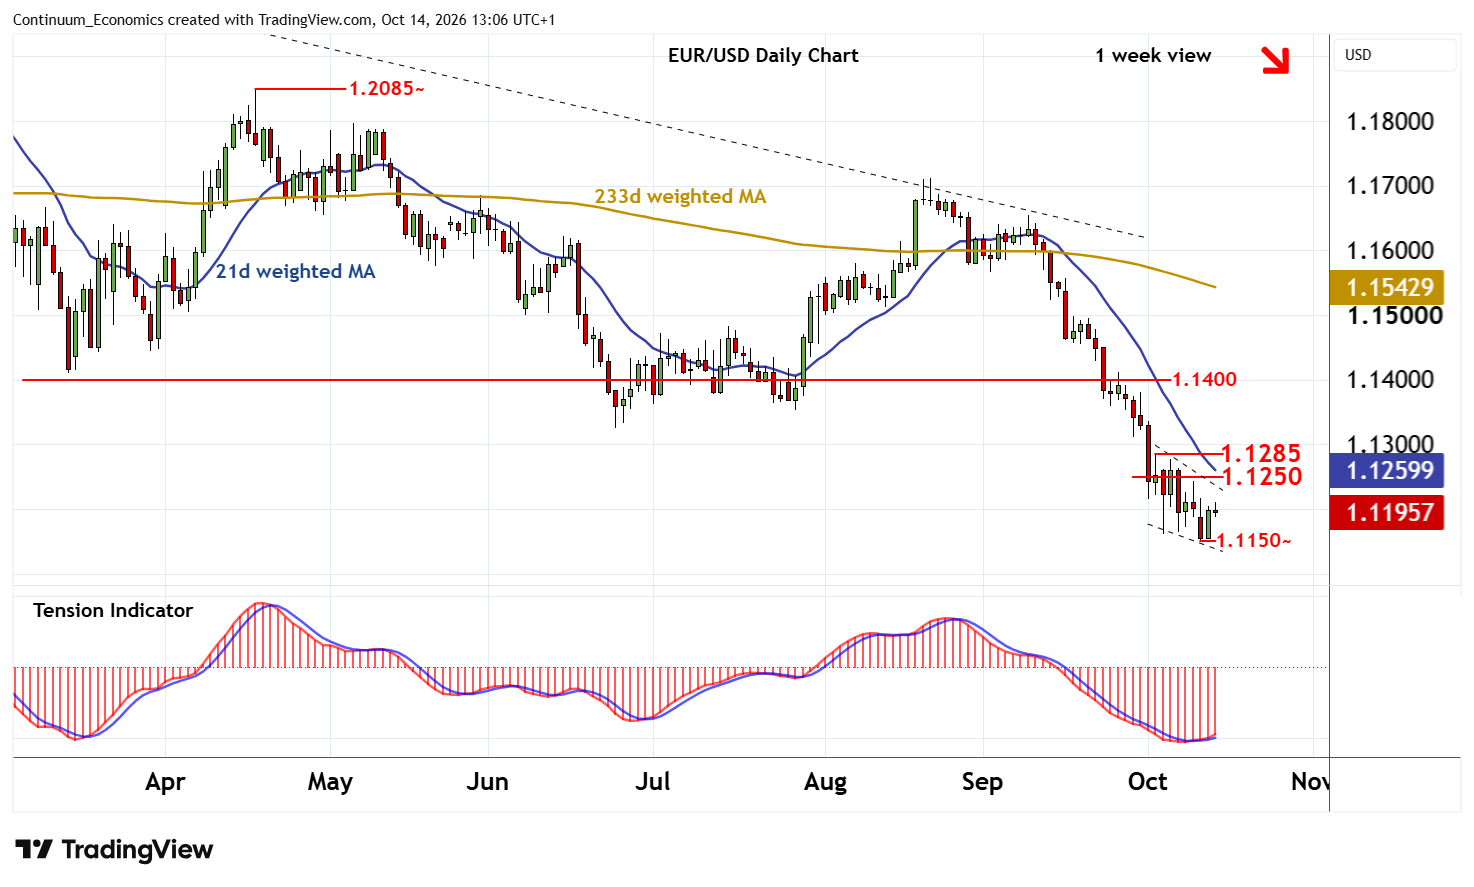
A close above 1.1250 would help to stabilise price action. But a further close above the 1.1285 high of 2 October is needed to improve sentiment and negate downside potential, as a more sustainable (corrective) bounce then unfolds. Focus will then turn to resistance at congestion around 1.1400.