Published: 2026-05-19T08:00:39.000Z
Chart USD Index DXY Update: Cautious trade
6
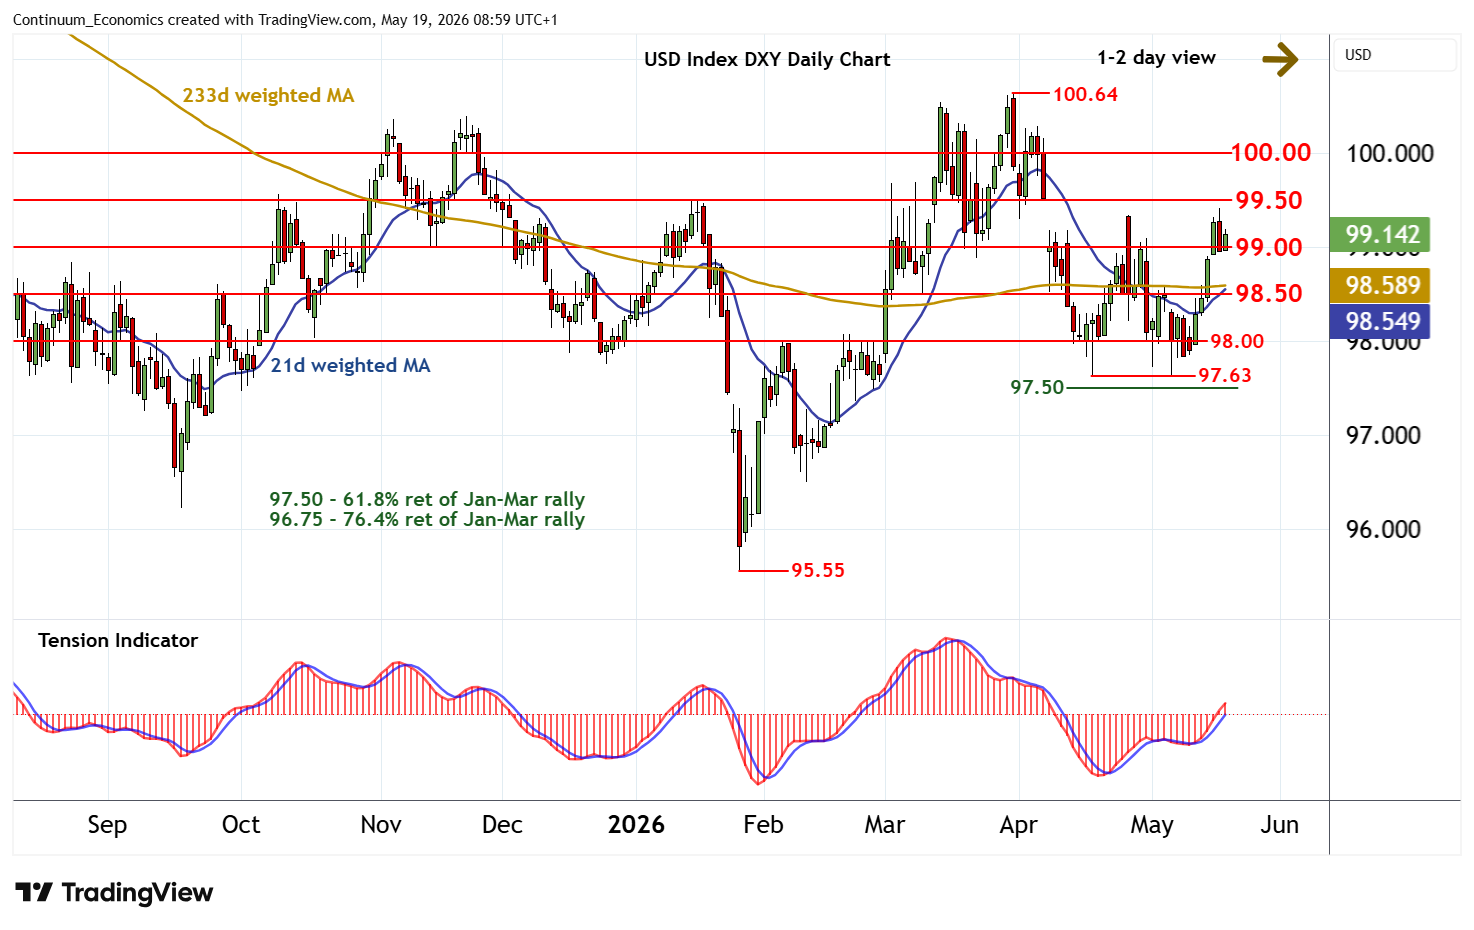
The anticipated test of congestion support at 99.00 is giving way to consolidation
| Levels | Imp | Comment | Levels | Imp | Comment | |||
|---|---|---|---|---|---|---|---|---|
| R4 | 100.64 | ** | 31 Mar YTD high | S1 | 99.00 | * | congestion | |
| R3 | 100.29 | * | 6 Apr (m) high | S2 | 98.50 | * | congestion | |
| R2 | 100.00 | ** | congestion | S3 | 98.00 | * | congestion | |
| R1 | 99.50 | * | congestion, gap high | S4 | 97.63 | ** | 17 Apr (m) low |
Asterisk denotes strength of level
08:50 BST - The anticipated test of congestion support at 99.00 is giving way to consolidation, as intraday studies turn mixed and overbought daily stochastics turn down, with prices currently trading around 99.15. The daily Tension Indicator continues to rise, highlighting room for a test of resistance at 99.50. But mixed weekly charts should limit any immediate break in selling interest/consolidation beneath congestion resistance at 100.00. Meanwhile, a test below 99.00 should give way to consolidation above further congestion around 98.50.