Published: 2026-07-24T07:26:58.000Z
Chart GBP/USD Update: Consolidating test of 1.3300
2
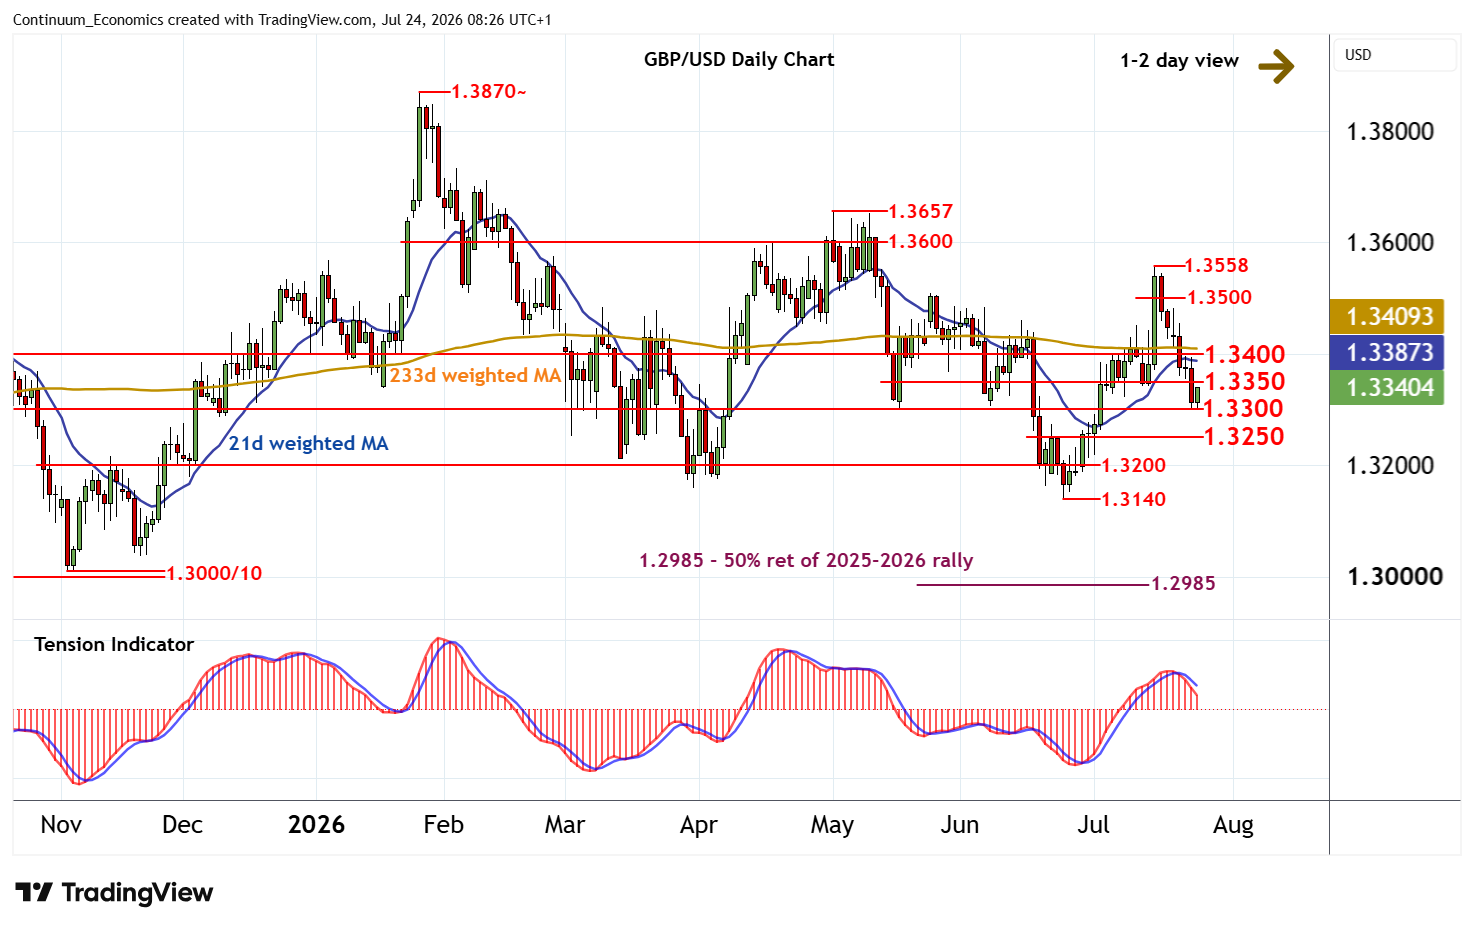
Anticipated losses have reached congestion support at 1.3300
| Level | Comment | Level | Comment | |||||
|---|---|---|---|---|---|---|---|---|
| R4 | 1.3550/58 | * | congestion; 15 Jul (w) high | S1 | 1.3300 | ** | congestion | |
| R3 | 1.3500 | * | congestion | S2 | 1.3250 | intraday break level | ||
| R2 | 1.3400 | ** | congestion | S3 | 1.3200 | ** | congestion | |
| R1 | 1.3350 | * | congestion | S4 | 1.3140 | ** | 24 Jun YTD low |
Asterisk denotes strength of level
08:10 BST - Anticipated losses have reached congestion support at 1.3300, where rising intraday studies and flattening oversold daily stochastics are prompting a bounce. Immediate focus is turning to congestion resistance at 1.3350. But the bearish daily Tension Indicator and mixed weekly charts should limit any break in fresh consolidation beneath further congestion around 1.3400. Meanwhile, a break below 1.3300 will open up 1.3250. Any initial tests should give way to consolidation.