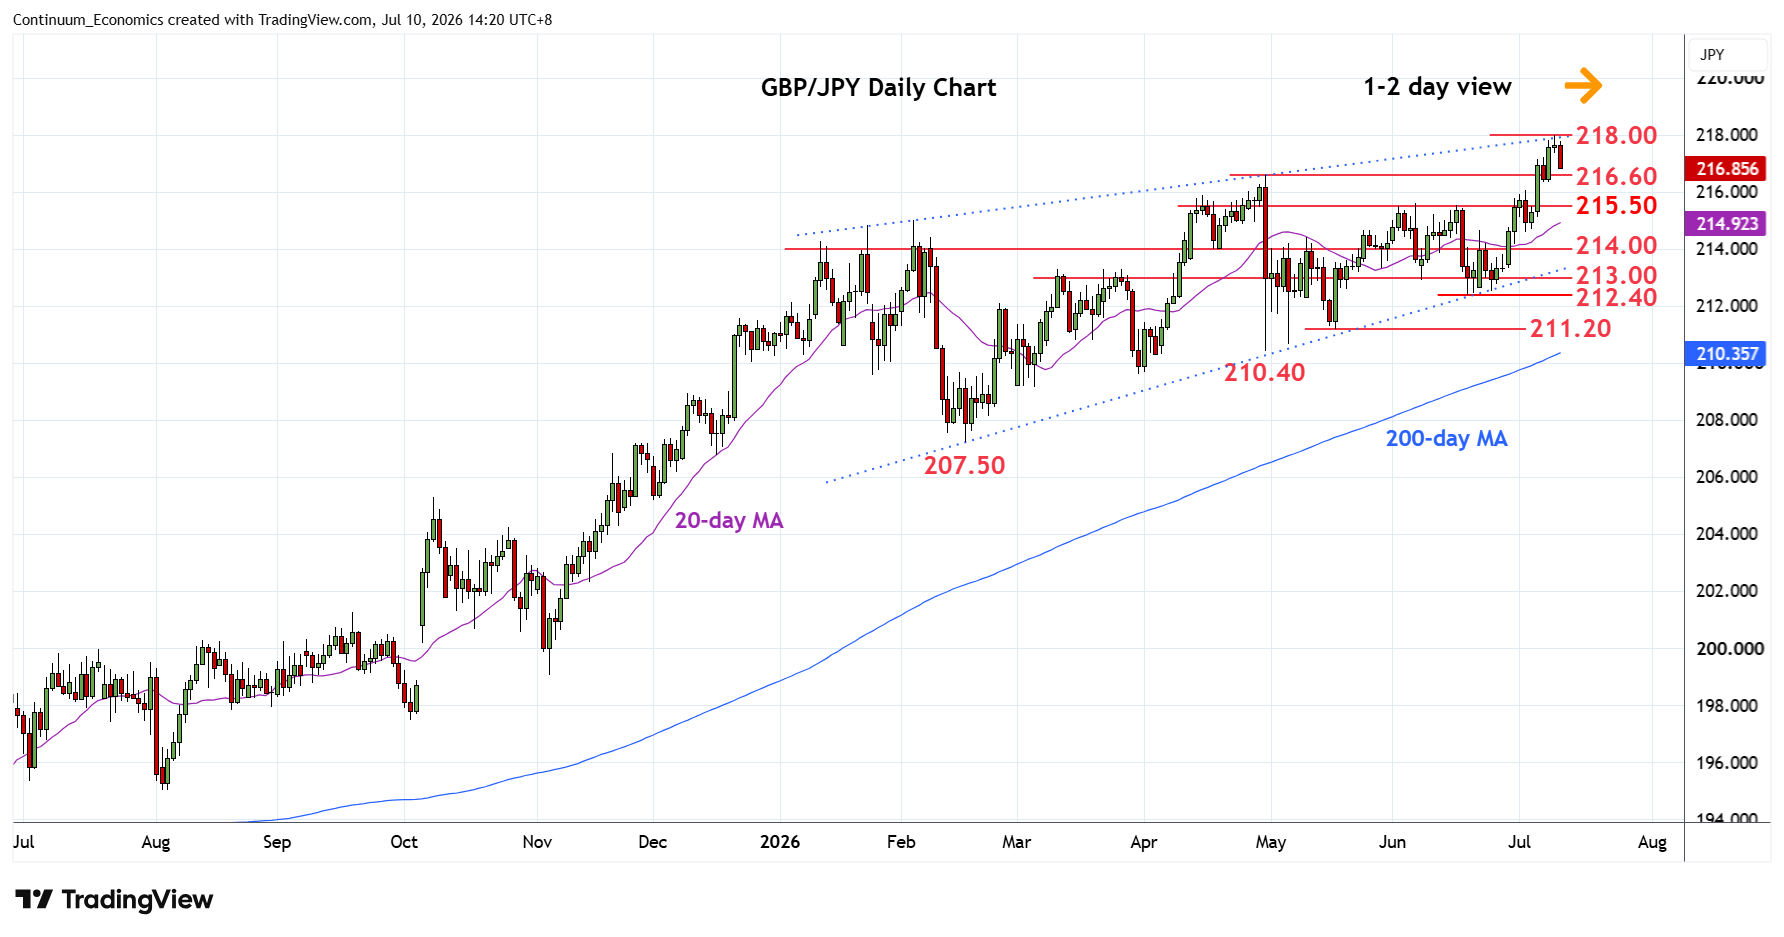
Chart GBP/JPY Update: Settled back from 218.00 multi-year high
Settled back from test of the wedge top from the February low at the 217.80/218.00 highs
| Levels | Imp | Comment | Levels | Imp | Comment | |||
|---|---|---|---|---|---|---|---|---|
| R4 | 224.00 | * | congestion | S1 | 216.60 | * | Apr high | |
| R3 | 222.00 | * | Nov 2007 low | S2 | 216.00 | * | congestion | |
| R2 | 220.00 | * | congestion | S3 | 215.50 | ** | 15 Jun high | |
| R1 | 218.00 | ** | 9 Jul YTD high, wedge top | S4 | 214.50/00 | * | congestion |
Asterisk denotes strength of level
06:25 GMT - Settled back from test of the wedge top from the February low at the 217.80/218.00 highs as prices unwind overbought intraday and daily studies. Divergence on weekly chart suggest gains from the 207.50 February current year low now being retraced. Pullback see support at the 216.60/215.50 congestion and April/June highs. Would take break of these to ease the upside pressure and see room for deeper pullback to retrace gains from 212.40 June low. Meanwhile, resistance at the 218.00 high is expected to cap. Break here will extend the underlying bull trend from the 2011 year low and see room to the 220.00/222.00 congestion area.