Chart USD Index DXY Update: Gains to remain limited
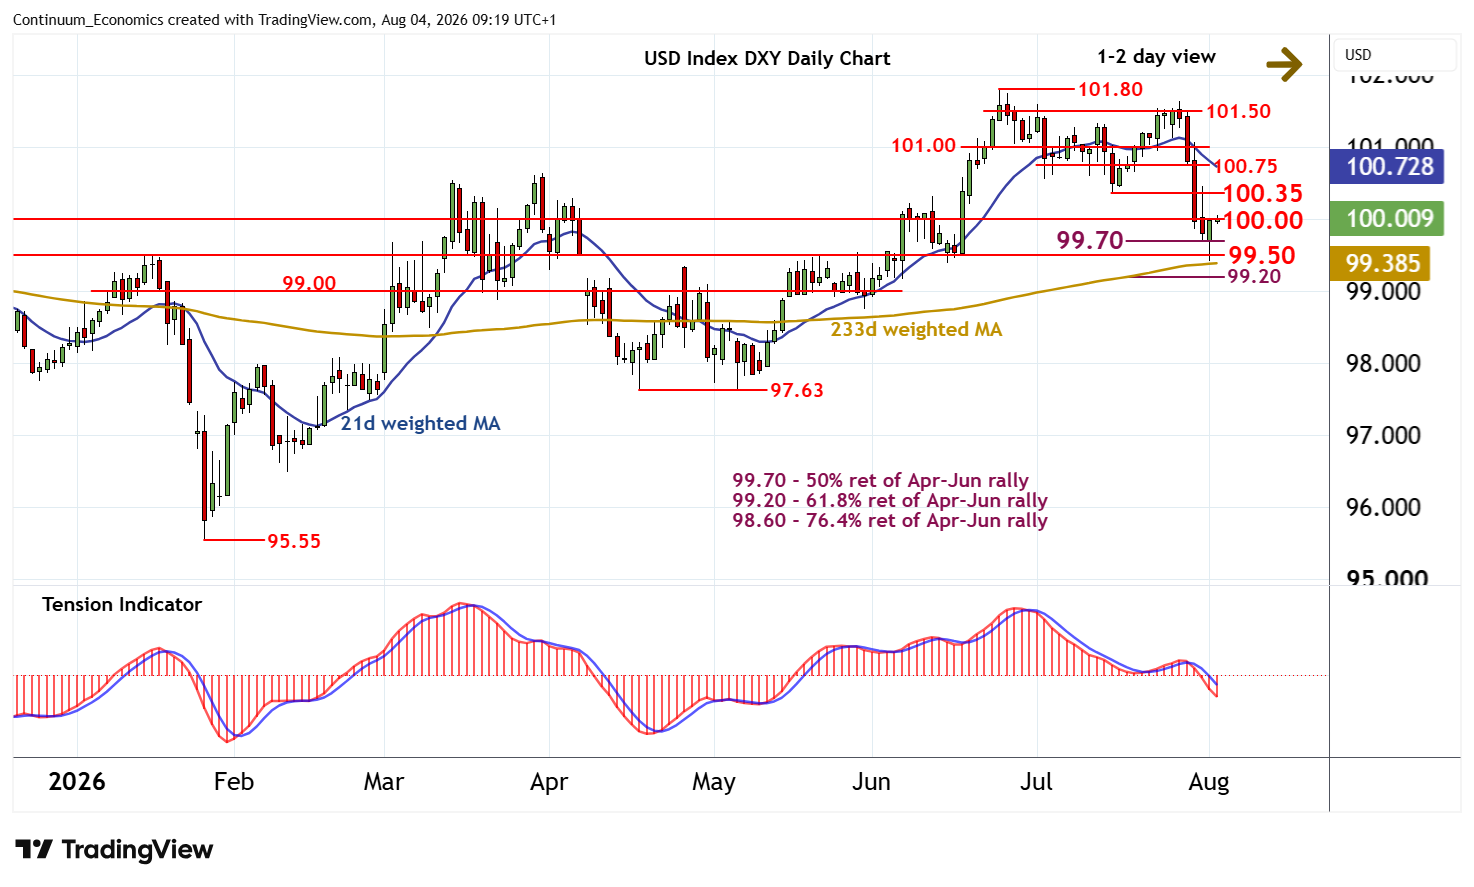
Consolidation has given way to the anticipated test of congestion resistance at 100.00
| Levels | Imp | Comment | Levels | Imp | Comment | |||
|---|---|---|---|---|---|---|---|---|
| R4 | 101.00 | ** | congestion base | S1 | 99.70 | ** | 50% ret of Apr-Jun rally | |
| R3 | 100.75 | congestion | S2 | 99.50 | ** | congestion | ||
| R2 | 100.35 | ** | 15 Jul (w) low | S3 | 99.20 | ** | 61.8% ret of Apr-Jun rally | |
| R1 | 100.00 | ** | congestion | S4 | 99.00 | ** | congestion |
Asterisk denotes strength of level
09:05 BST - Consolidation has given way to the anticipated test of congestion resistance at 100.00, where overbought intraday studies are prompting fresh consolidation. Oversold daily stochastics are flattening, suggesting room for a test above here. But the negative daily Tension Indicator and deteriorating weekly charts should limit any break in renewed selling interest towards the 100.35 weekly low of 15 July. Following cautious trade, fresh losses are looked for. Support remains at the 99.70 Fibonacci retracement. A close beneath here will put focus back on congestion around 99.50 with scope for continuation of late-June losses towards the 99.20 retracement.