Chart USD Index DXY Update: Limited tests higher - studies under pressure
Cautious trade has given way to a test above 101.00
| Levels | Imp | Comment | Levels | Imp | Comment | |||
|---|---|---|---|---|---|---|---|---|
| R4 | 102.85 | ** | 50% ret of 2025-2026 fall | S1 | 101.00 | ** | congestion base | |
| R3 | 102.00 | ** | congestion | S2 | 100.64 | ** | 31 Mar (m) high | |
| R2 | 101.80 | * | 24 Jun YTD high | S3 | 100.00 | ** | congestion | |
| R1 | 101.50 | intraday break level | S4 | 99.50 | * | congestion |
Asterisk denotes strength of level
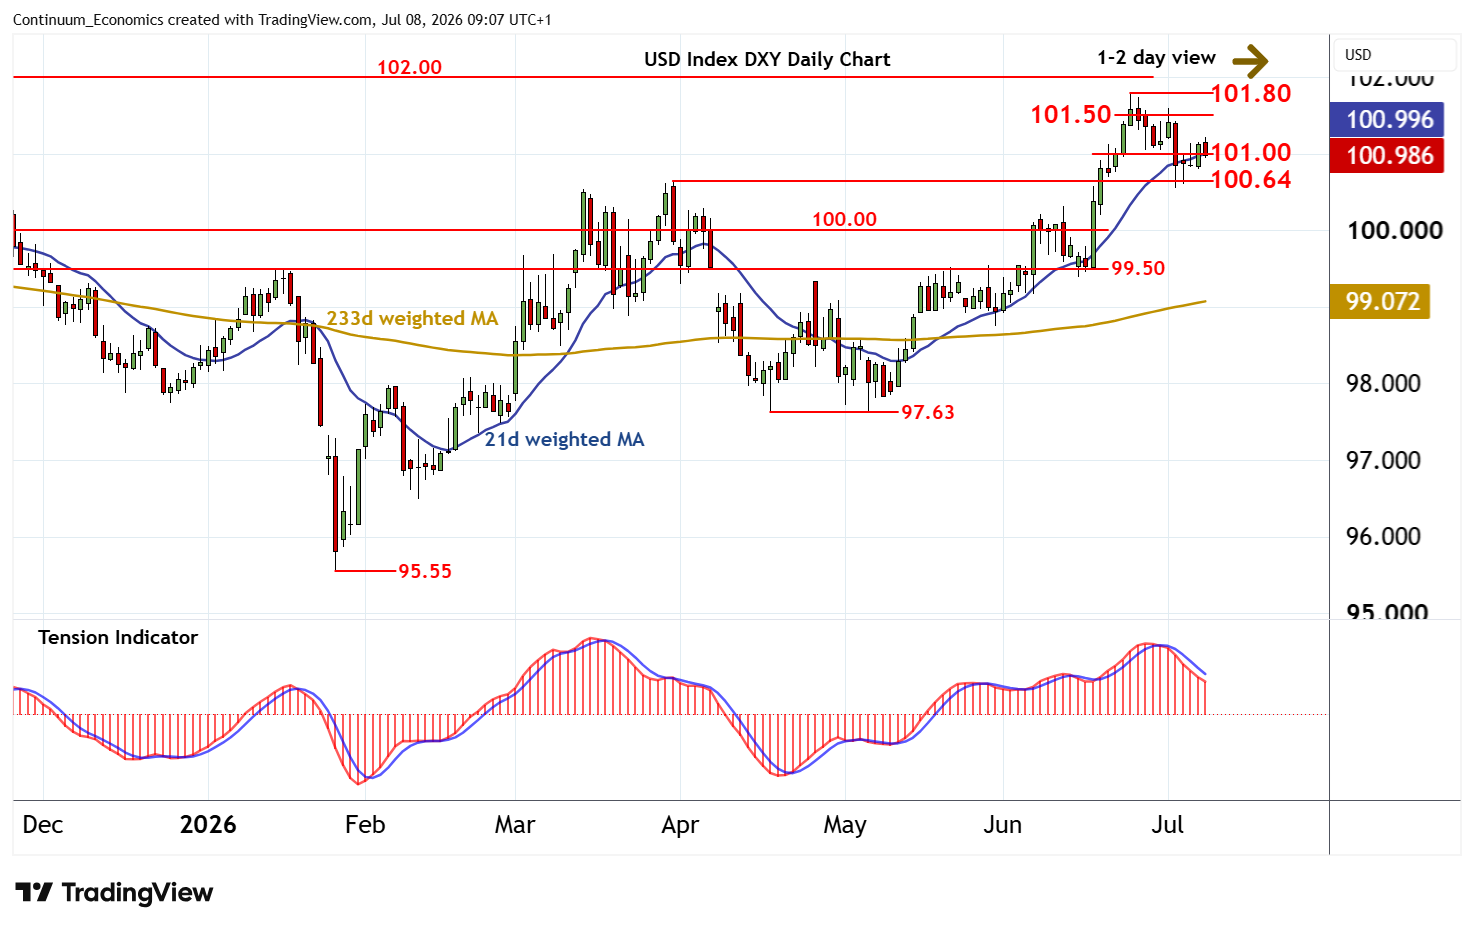
09:05 BST - Cautious trade has given way to a test above 101.00, with prices reaching 101.20~ before settling into consolidation around 101.00 as intraday studies turn down. Daily readings continue to fall and overbought weekly stochastics are also under pressure, highlighting room for renewed selling interest in the coming sessions. A break back below 101.00 will open up support at the 100.64 monthly high of 31 March. A break beneath here will add weight to sentiment and extend late-June losses towards congestion support at 100.00. But the positive weekly Tension Indicator and rising longer-term charts should limit any tests in renewed buying interest. Meanwhile, resistance at 101.50 should cap any immediate tests higher.