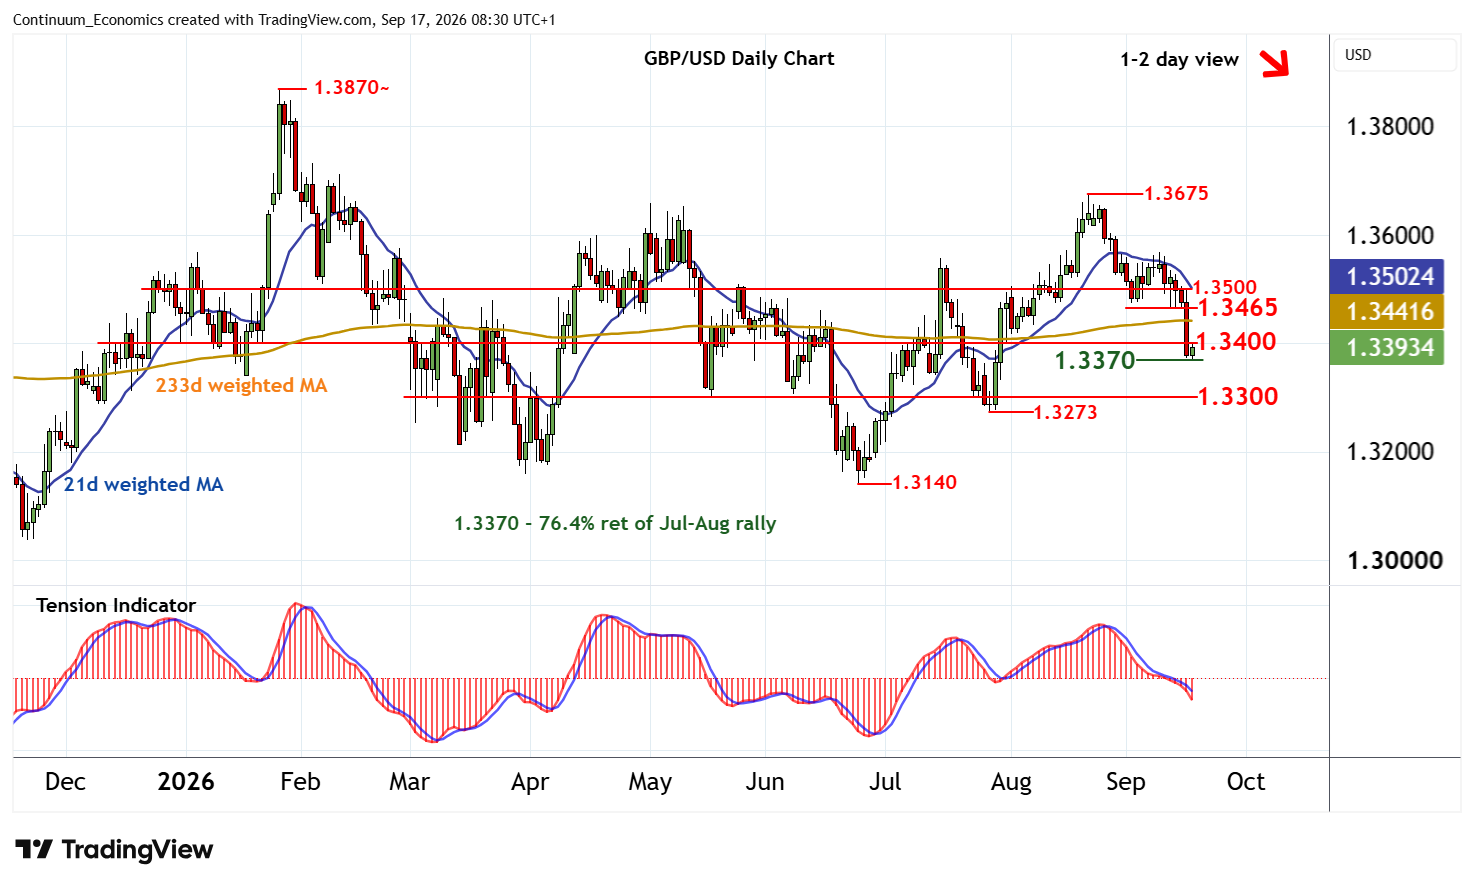
Chart GBP/USD Update: Short-term reactions from the 1.3370 Fibonacci retracement
Anticipated losses have reached strong support at the 1.3370 Fibonacci retracement
| Level | Comment | Level | Comment | |||||
|---|---|---|---|---|---|---|---|---|
| R4 | 1.3550 | * | range highs | S1 | 1.3370 | ** | 76.4% ret of Jul-Aug rally | |
| R3 | 1.3500 | * | congestion | S2 | 1.3300 | ** | congestion | |
| R2 | 1.3465 | * | recent lows | S3 | 1.3273 | ** | 28 Jul (w) low | |
| R1 | 1.3400 | ** | congestion | S4 | 1.3200 | ** | congestion |
Asterisk denotes strength of level
08:10 BST - Anticipated losses have reached strong support at the 1.3370 Fibonacci retracement, where unwinding oversold intraday studies and flat oversold daily stochastics are prompting short-covering and minor bounce. Immediate focus is on congestion resistance at 1.3400. A test above here cannot be ruled out. But the bearish daily Tension Indicator and deteriorating weekly charts should limit scope in renewed selling interest beneath the 1.3465 recent lows.
Following cautious/corrective trade, fresh losses are looked for. A close below 1.3370 will add weight to sentiment and extend losses from the 1.3675 monthly high of 21 August towards congestion around 1.3300.