Published: 2026-06-09T08:28:10.000Z
Chart USD Index DXY Update: Consolidating gains - studies improving
1
Recent sharp gains are giving way to a pullback from 100.21
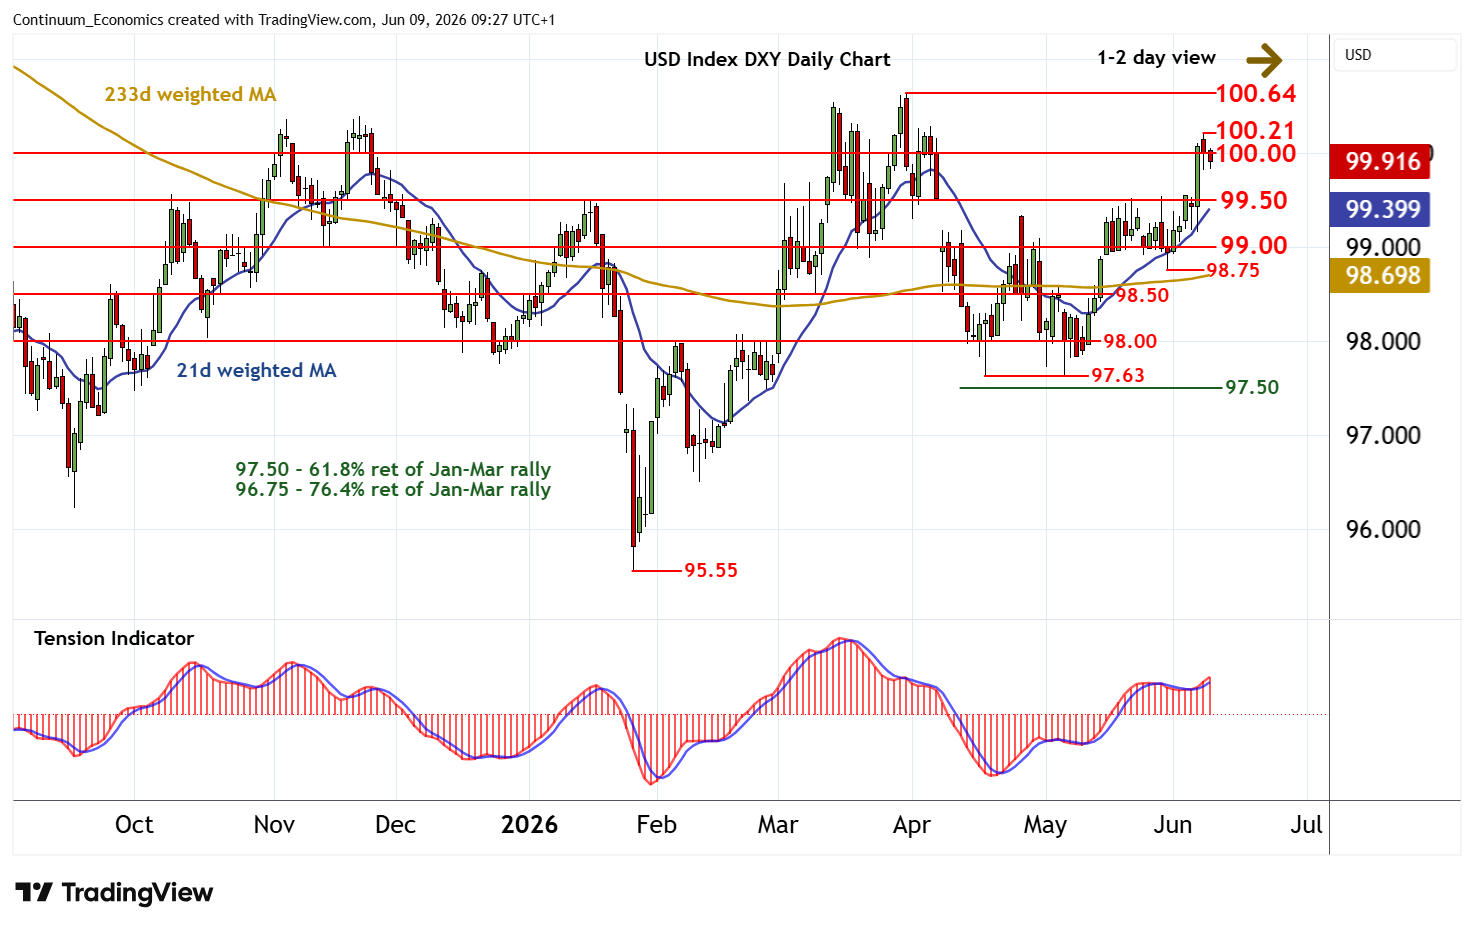
| Levels | Imp | Comment | Levels | Imp | Comment | |||
|---|---|---|---|---|---|---|---|---|
| R4 | 101.15 | ** | 38.2% ret of 2025-2026 fall | S1 | 99.50 | * | congestion | |
| R3 | 100.64 | ** | 31 Mar YTD high | S2 | 99.00 | * | congestion | |
| R2 | 100.21 | * | 8 Jun high | S3 | 98.75 | 29 May (w) low | ||
| R1 | 100.00 | ** | congestion | S4 | 98.50 | * | congestion |
Asterisk denotes strength of level
09:10 BST - Recent sharp gains are giving way to a pullback from 100.21, as intraday studies turn down, with prices once again trading below congestion resistance at 100.00. Support is down to congestion around 99.50. But rising daily and weekly readings should limit any deeper losses in renewed buying interest/consolidation above here. Following cautious/corrective trade, fresh gains are looked for. A close above the 100.21 high of 8 June will improve sentiment. But a further close above the 100.64 current year high of 31 March is needed to turn sentiment positive and extend mid-April gains towards the 101.15 Fibonacci retracement.