Chart GBP/USD Update: Consolidating at 1.3200
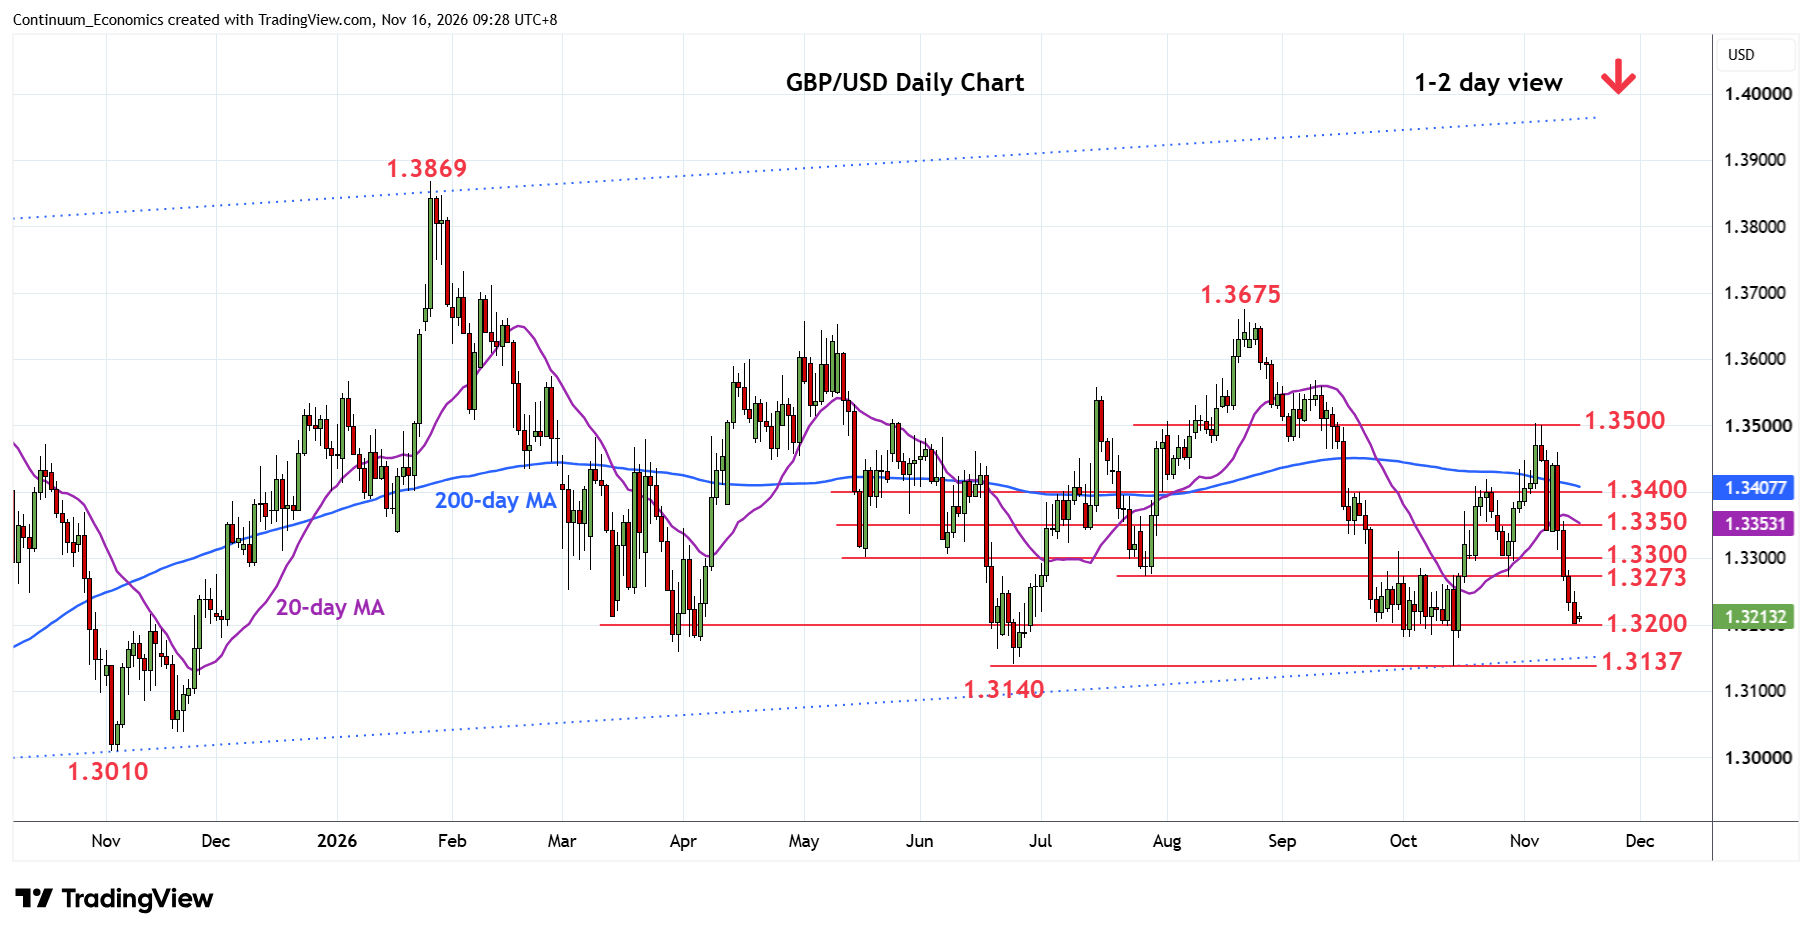
Steadied at the 1.3200 level as prices consolidate sharp losses last week and unwind oversold intraday studies
| Level | Comment | Level | Comment | |||||
|---|---|---|---|---|---|---|---|---|
| R4 | 1.3400 | ** | congestion | S1 | 1.3200 | * | congestion | |
| R3 | 1.3350 | * | congestion | S2 | 1.3140/37 | ** | Jun/14 Oct YTD lows | |
| R2 | 1.3300 | ** | congestion | S3 | 1.3100 | * | congestion | |
| R1 | 1.3273 | * | 28 Jul low | S4 | 1.3010 | ** | Nov 2025 low |
Asterisk denotes strength of level
01:30 GMT - Steadied at the 1.3200 level as prices consolidate sharp losses last week and unwind oversold intraday studies. However, pressure remains on the downside and lower will see room to the strong support at the 1.3140/1.3137, June low and October current year low. Would expect this area to underpin and give way to fresh buying interest later. Failure here will see room to the 1.3100 level then the 1.3010 low of November 2025. Meanwhile, resistance remains at the 1.3273/1.3300 area which is expected to cap corrective bounce. Above here will fade the downside pressure and see room for stronger bounce to retrace losses from the 1.3500 high.