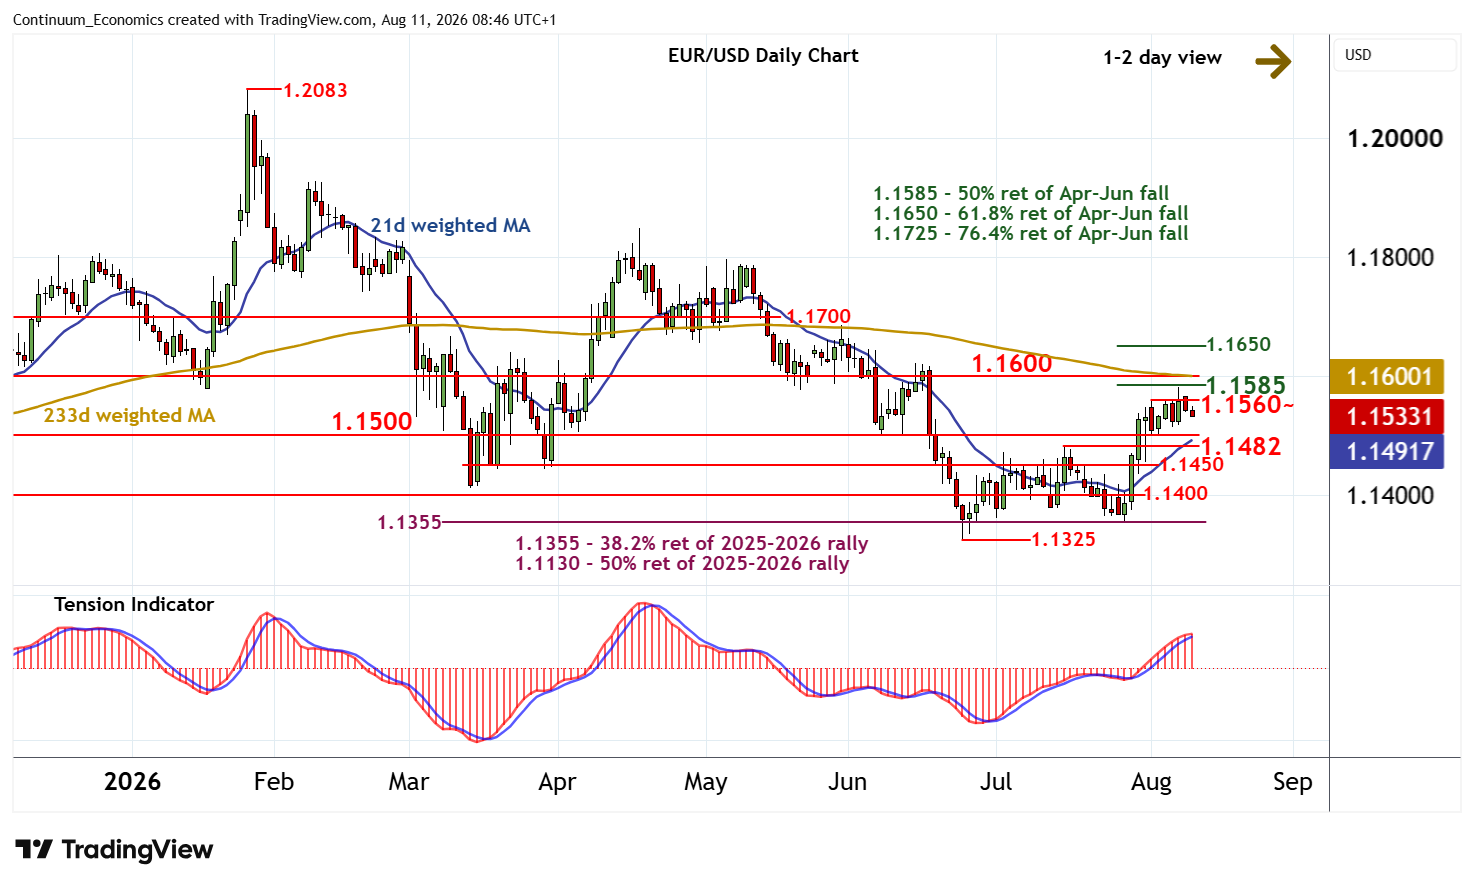
Chart EUR/USD Update: Back in range - background studies rising
The retest of resistance within the 1.1560~ - 1.1585 range is giving way to a pullback
| Levels | Imp | Comment | Levels | Imp | Comment | |||
|---|---|---|---|---|---|---|---|---|
| R4 | 1.1620~ | * | 15 Jun (w) high | S1 | 1.1500 | ** | congestion | |
| R3 | 1.1600 | * | congestion | S2 | 1.1482 | ** | 15 Jul (w) high | |
| R2 | 1.1585 | ** | 50% ret of Apr-Jun fall | S3 | 1.1450 | * | congestion | |
| R1 | 1.1560~ | * | 3 Aug (w) high | S4 | 1.1400 | * | congestion |
*Asterisk denotes strength of level
08:35 BST - The retest of resistance within the 1.1560~ - 1.1585 range is giving way to a pullback, as intraday studies turn down, with prices currently trading around 1.1535. Overbought daily stochastics are flat and the positive daily Tension Indicator is flattening, highlighting room for continuation down to strong support at congestion around 1.1500 and the 1.1482 weekly high of 15 July. However, rising weekly charts should limit any tests of this range in renewed buying interest/consolidation. Following cautious/corrective trade, fresh gains are looked for. However, a close above the 1.1585 Fibonacci retracement is needed to turn sentiment positive and extend late-June gains beyond congestion around 1.1600 towards the 1.1650 retracement. Meanwhile, a close below 1.1482 - 1.1500, if seen, will add weight to sentiment and extend losses towards 1.1450.