Published: 2026-05-25T06:55:52.000Z
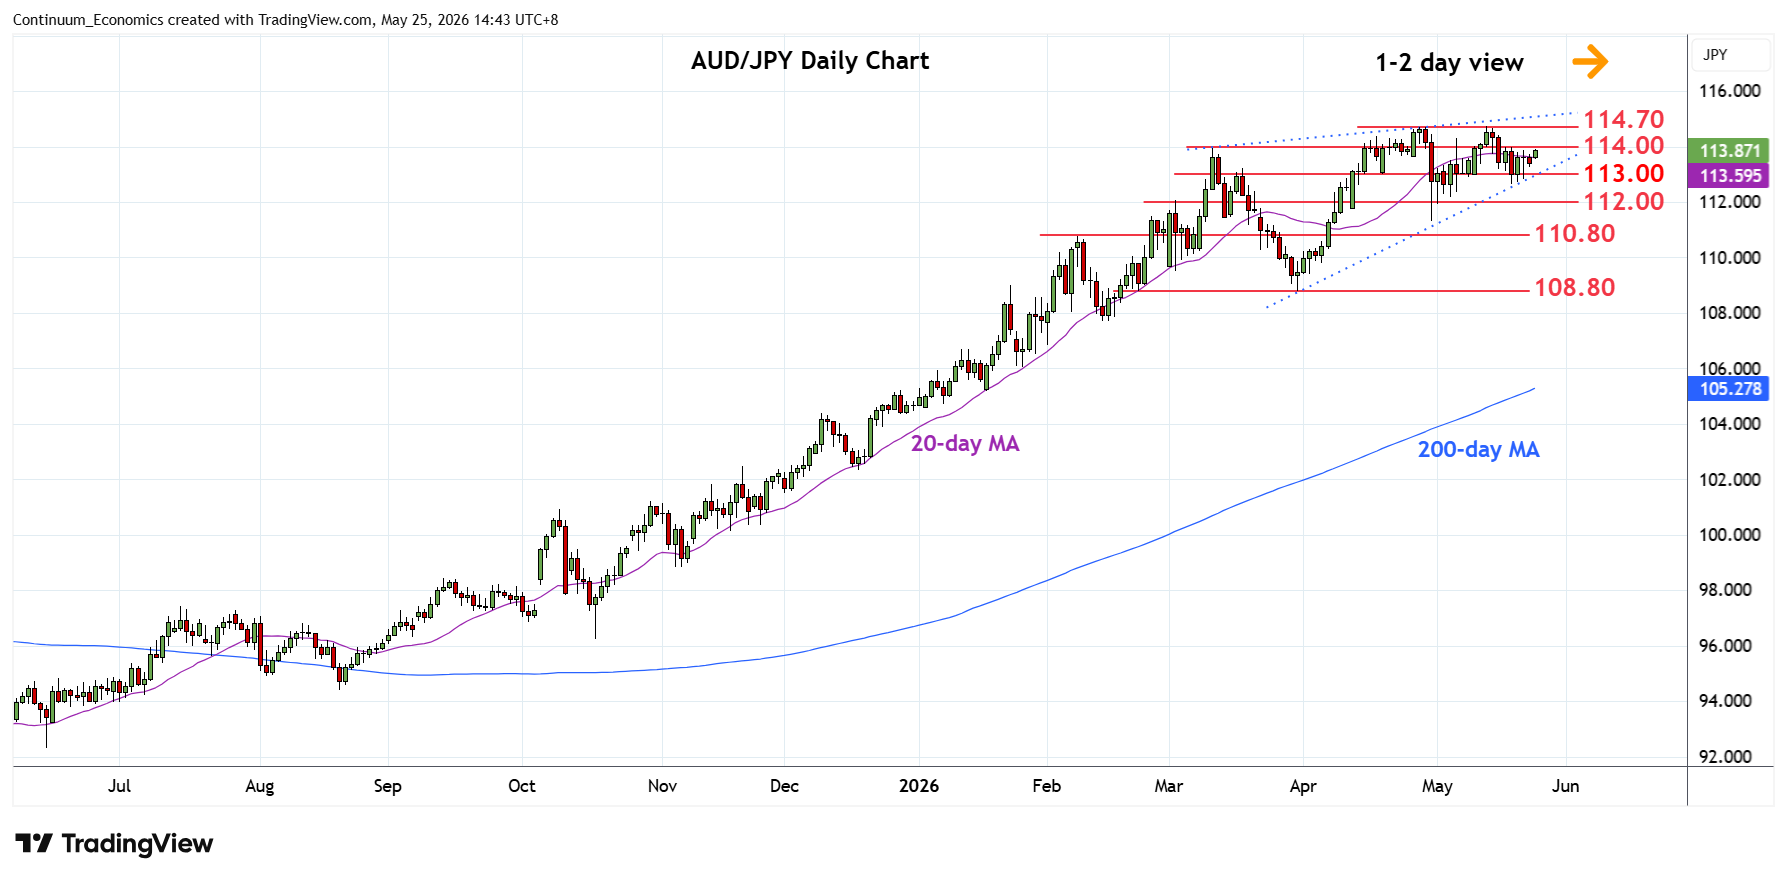
Chart AUD/JPY Update: Higher within 114.00/113.00 range
1
Higher in consolidation within the 114.00/113.00 range area to pressure resistance at the 114.00 congestion
| Levels | Imp | Comment | Levels | Imp | Comment | |||
|---|---|---|---|---|---|---|---|---|
| R4 | 116.00 | * | congestion | S1 | 113.00 | * | congestion | |
| R3 | 115.00 | * | congestion | S2 | 112.60 | * | 19 May low | |
| R2 | 114.70 | ** | 28 Apr YTD high | S3 | 112.00 | * | congestion | |
| R1 | 114.00 | * | Mar high, congestion | S4 | 111.30 | ** | 30 Apr low |
Asterisk denotes strength of level
06:45 GMT - Higher in consolidation within the 114.00/113.00 range area to pressure resistance at the 114.00 congestion. Break here will extendbounce from the 112.60 low of last week and return focus to the 114.70 the April/May highs which are expected to cap. Cleearance will extend gains from the April 2025 low and see room to 115.00/116.00 congestion area. Meanwhile, support is at the 113.00 congestion which extend to 112.60 low of 19 May. This area should underpin and only failure here will open up room for deeper pullback 112.00 and 111.30, 30 April low.