Published: 2026-07-30T01:00:13.000Z
Chart USD/JPY Update: Lower in consolidation
5
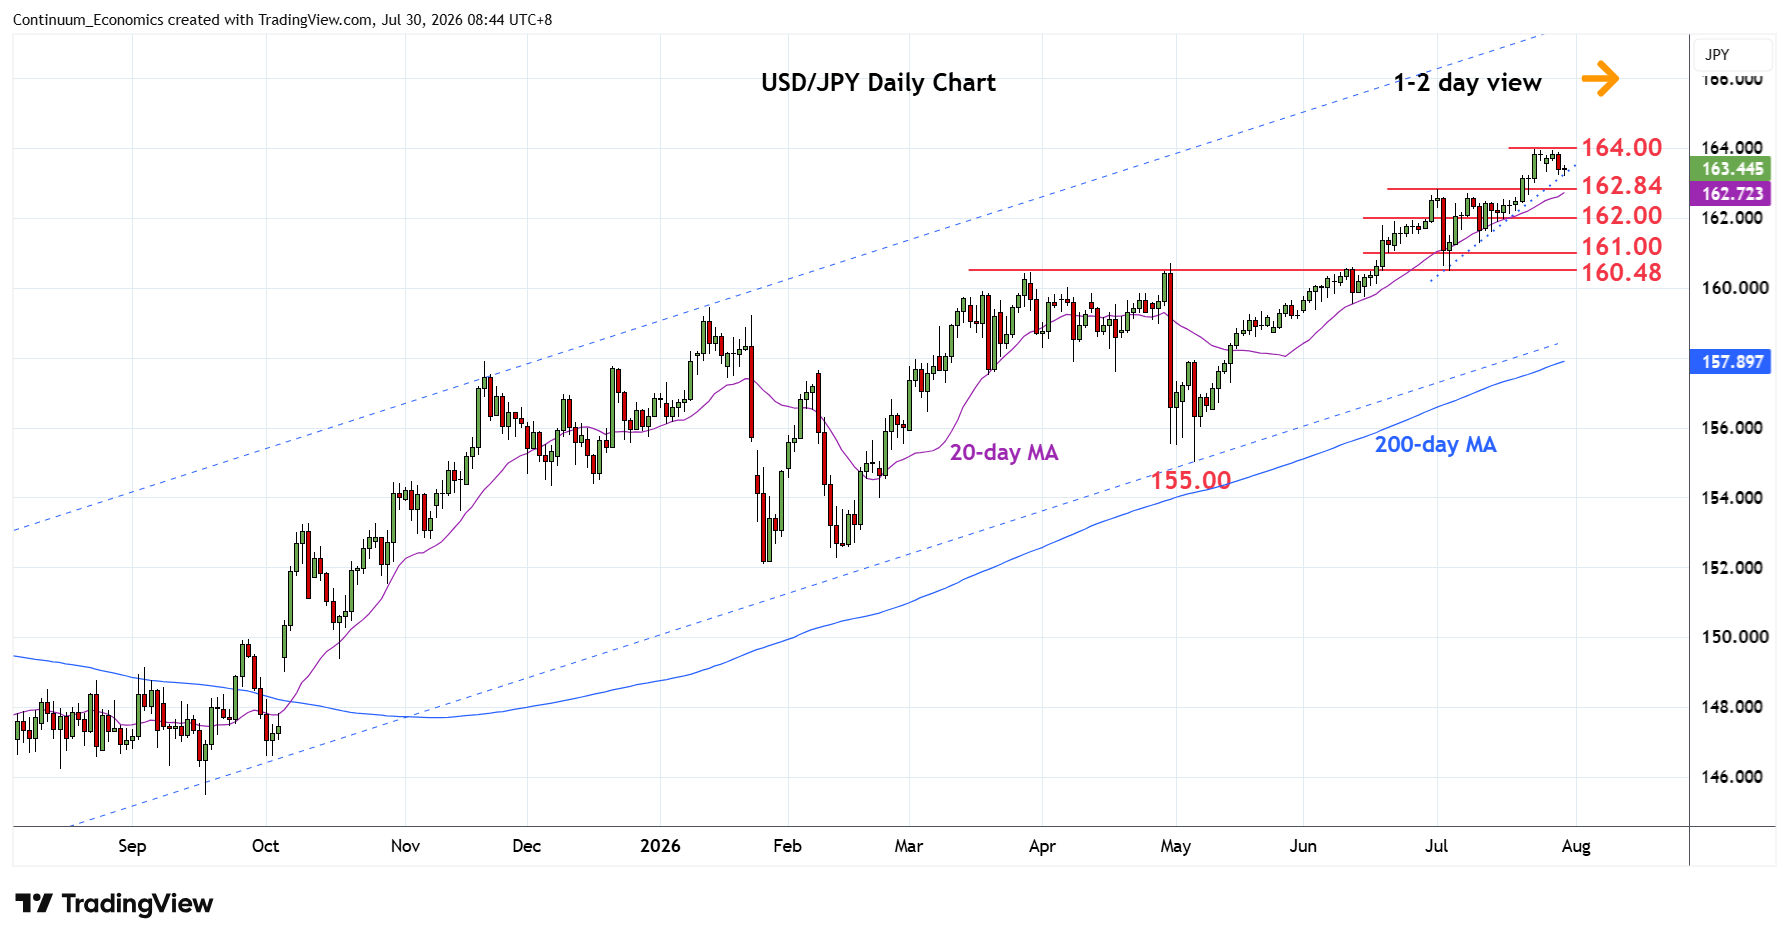
Settled back in range from the 164.00 high of last week as prices unwind overbought daily studies
| Levels | Imp | Comment | Levels | Imp | Comment | |||
|---|---|---|---|---|---|---|---|---|
| R4 | 165.00 | * | figure | S1 | 163.24 | * | 21 Jul high | |
| R3 | 164.95 | ** | Nov 1986 high | S2 | 162.84 | ** | 1 Jul high | |
| R2 | 164.55 | * | 24 Nov 1986 high | S3 | 162.50/00 | * | congestion | |
| R1 | 164.00 | ** | Dec 1986 high | S4 | 161.28/00 | * | 10 Jul low, congestion |
Asterisk denotes strength of level
00:50 GMT - Settled back in range from the 164.00 high of last week as prices unwind overbought daily studies. Pullback from the 164.00 high see bullish momentum showing signs of faltering. Nearby see support at the 163.24 and 162.84 recent July highs. Would take break here to ease the upside pressure and open up room for deeper pullback to correct strong gains from the 155.00 May low. Lower will see room to support at 162.00 congestion then 161.28/00 area. Meanwhile, resistance at the 164.00 is expected to cap. Clearance, if seen, will open up room for extension to retest 164.55/164.95 highs of November 1986.