Published: 2026-07-10T00:23:24.000Z
Chart AUD/USD Update: Extend consolidation
-
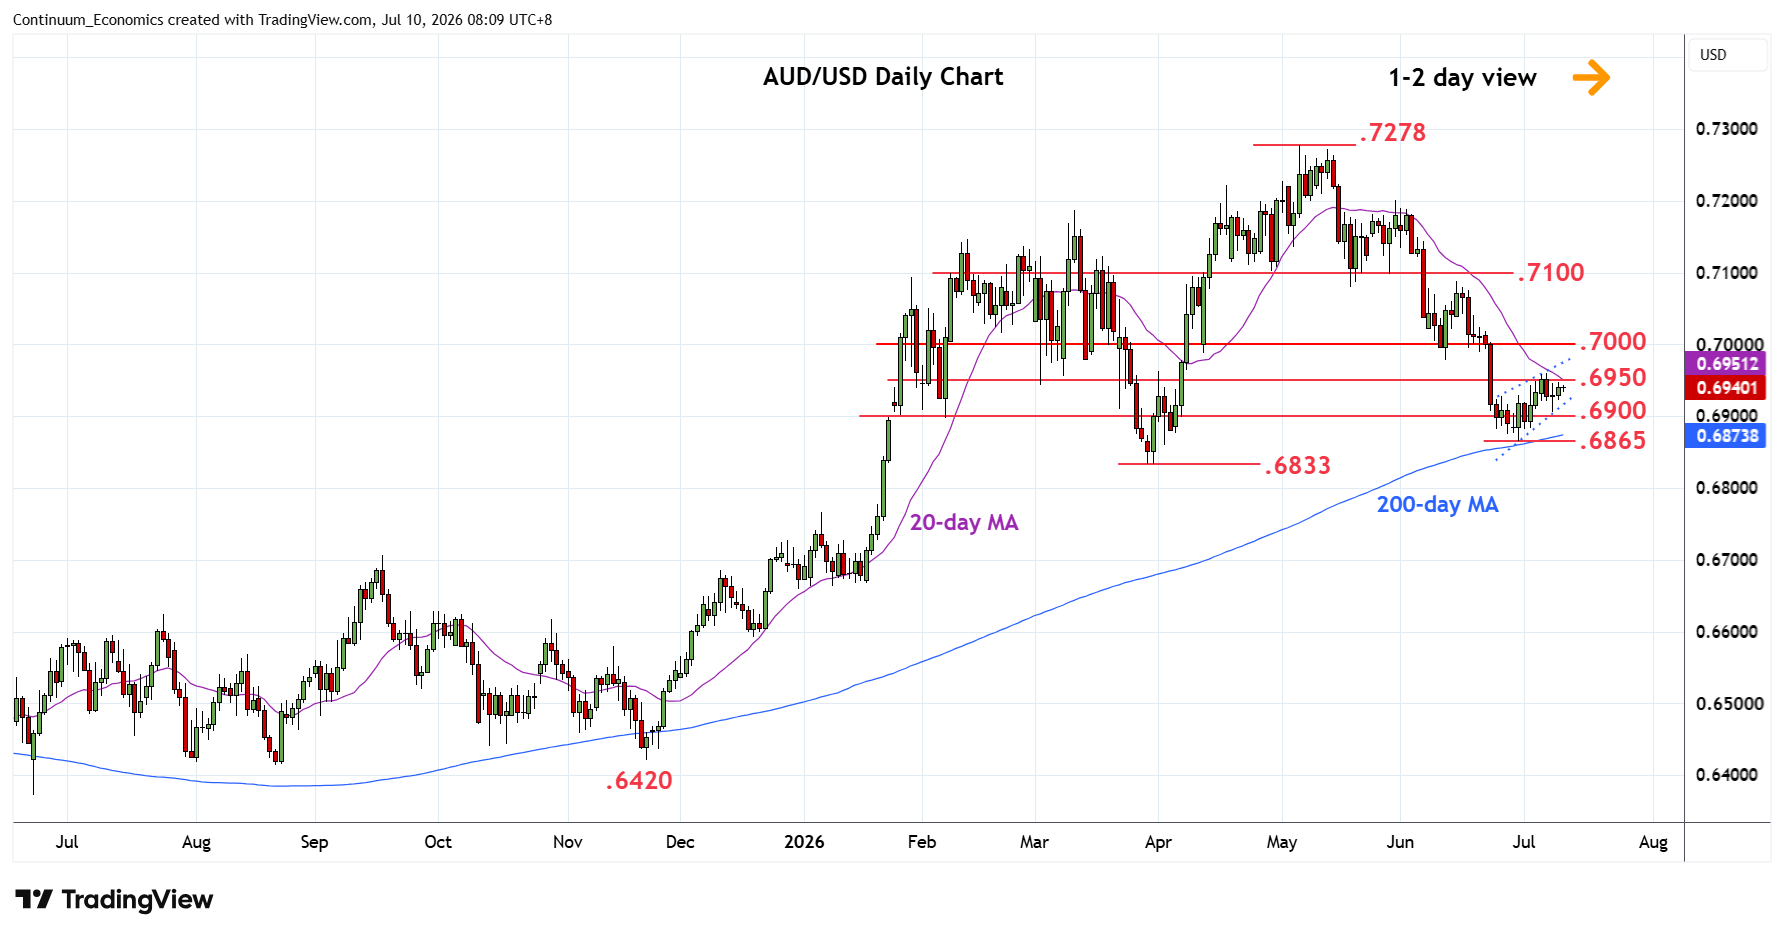
Little change, as prices extend consolidation within the .6900/.6950 range
| Levels | Imp | Comment | Levels | Imp | Comment | |||
|---|---|---|---|---|---|---|---|---|
| R4 | 0.7050 | * | congestion | S1 | 0.6900 | * | congestion | |
| R3 | 0.7000 | ** | congestion | S2 | 0.6865 | ** | Jun low | |
| R2 | 0.6980 | * | 11 Jun low | S3 | 0.6833 | ** | Mar low | |
| R1 | 0.6950 | * | congestion | S4 | 0.6800 | * | congestion |
Asterisk denotes strength of level
00:10 GMT - Little change, as prices extend consolidation within the .6900/.6950 range. The resulting bearish wedge pattern suggest this giving way to break lower later through the .6900 support and .6865 low to further extend losses from the May high. Lower will see room for retest of the .6833 March low and the .6800 figure. Meanwhile, break above resistance at the .6950/60 area will see room for further gains towards strong resistance at the .6980/.7000 area which is expected to cap. Above the latter will fade the downside pressure and see room for stronger gains to retrace May/June losses.