Published: 2026-08-18T00:26:51.000Z
Chart AUD/USD Update: Room to extend gains
2
Break above resistance at .7080/.7100 see prices extending the bullish gains from the .6865 June low to reach the .7120 Fibonacci level
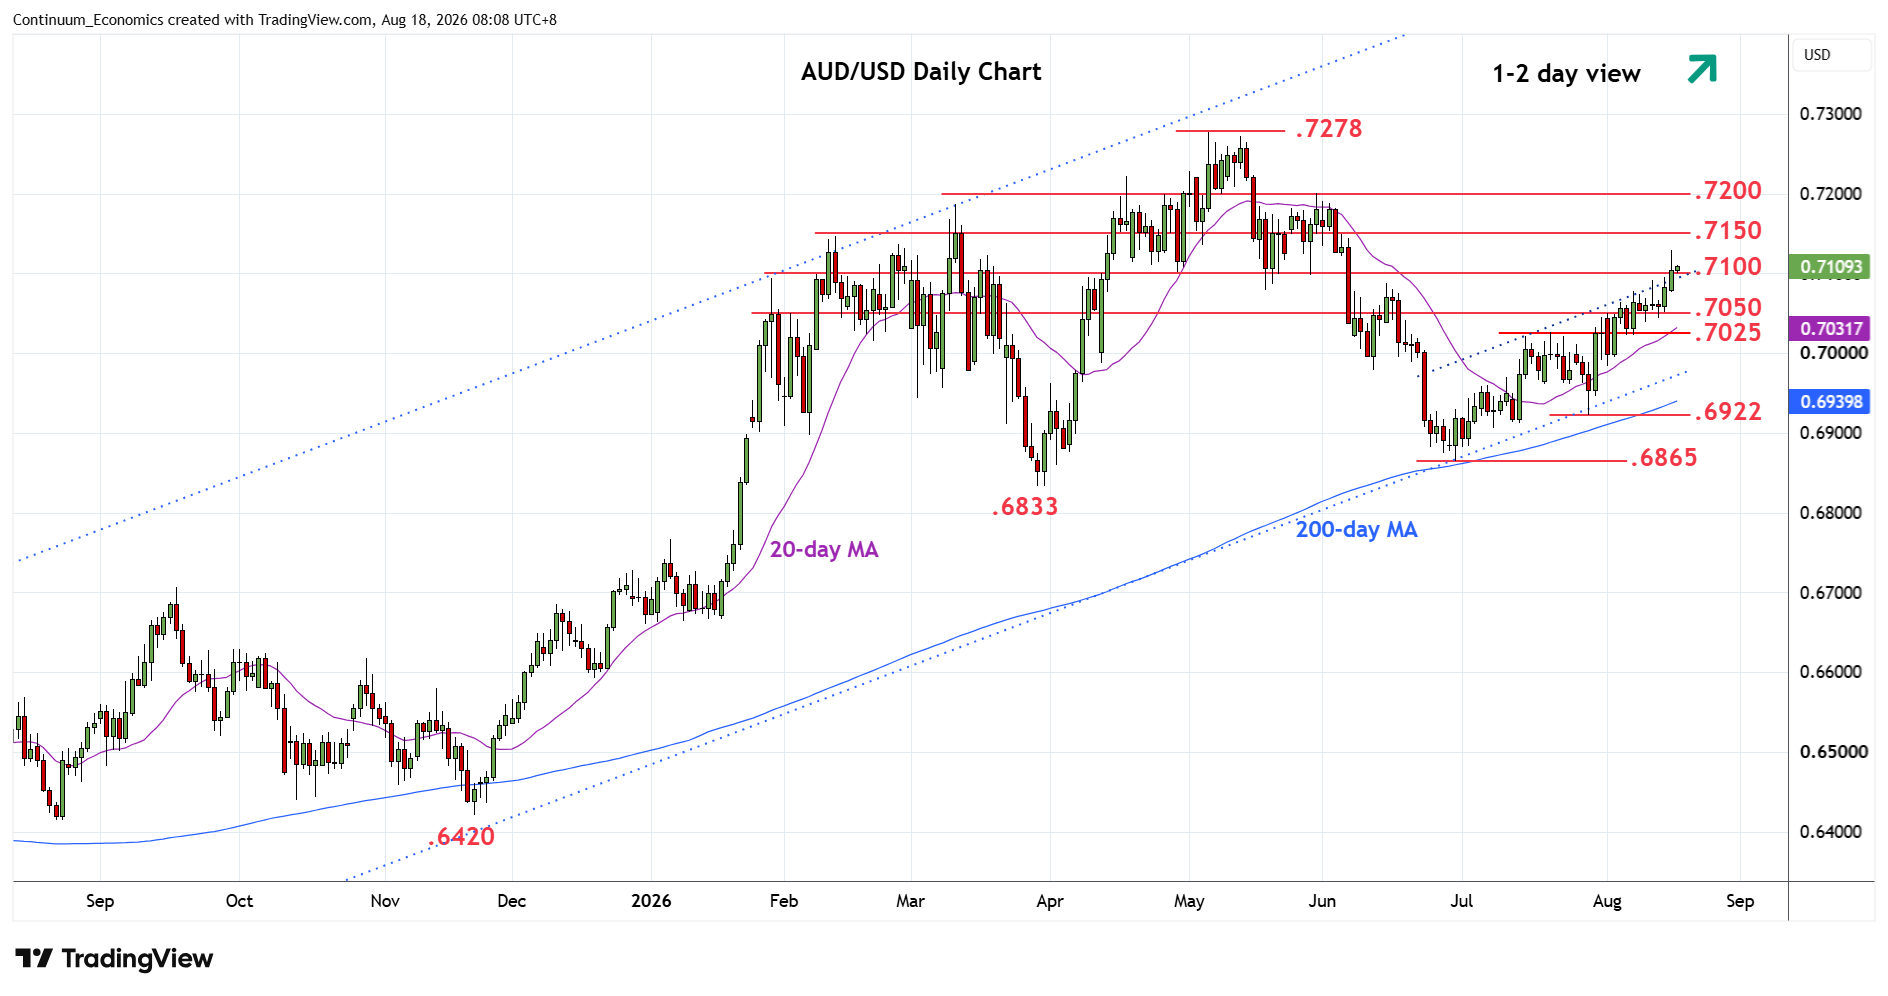
| Levels | Imp | Comment | Levels | Imp | Comment | |||
|---|---|---|---|---|---|---|---|---|
| R4 | 0.7278 | ** | 6 May YTD high | S1 | 0.7100 | * | congestion | |
| R3 | 0.7200 | ** | congestion | S2 | 0.7050 | * | congestion | |
| R2 | 0.7150 | * | congestion | S3 | 0.7025 | ** | 21 Jul high | |
| R1 | 0.7120 | * | 61.8% May/Jun fall | S4 | 0.7000 | * | congestion |
Asterisk denotes strength of level
00:20 GMT - Break above resistance at .7080/.7100 see prices extending the bullish gains from the .6865 June low to reach the .7120 Fibonacci level before settling back in consolidation. Bullish price action keep pressure firmly on the upside and higher will see room for extension to .7150/.7200 congestion area. Break hyere will return focus to the May current year high at .7278. Meanwhile, support is raised to the .7100 level. Below here will give way to consolidation to unwind overbought daily studies and see room to .7050 congestion and .7025 support.