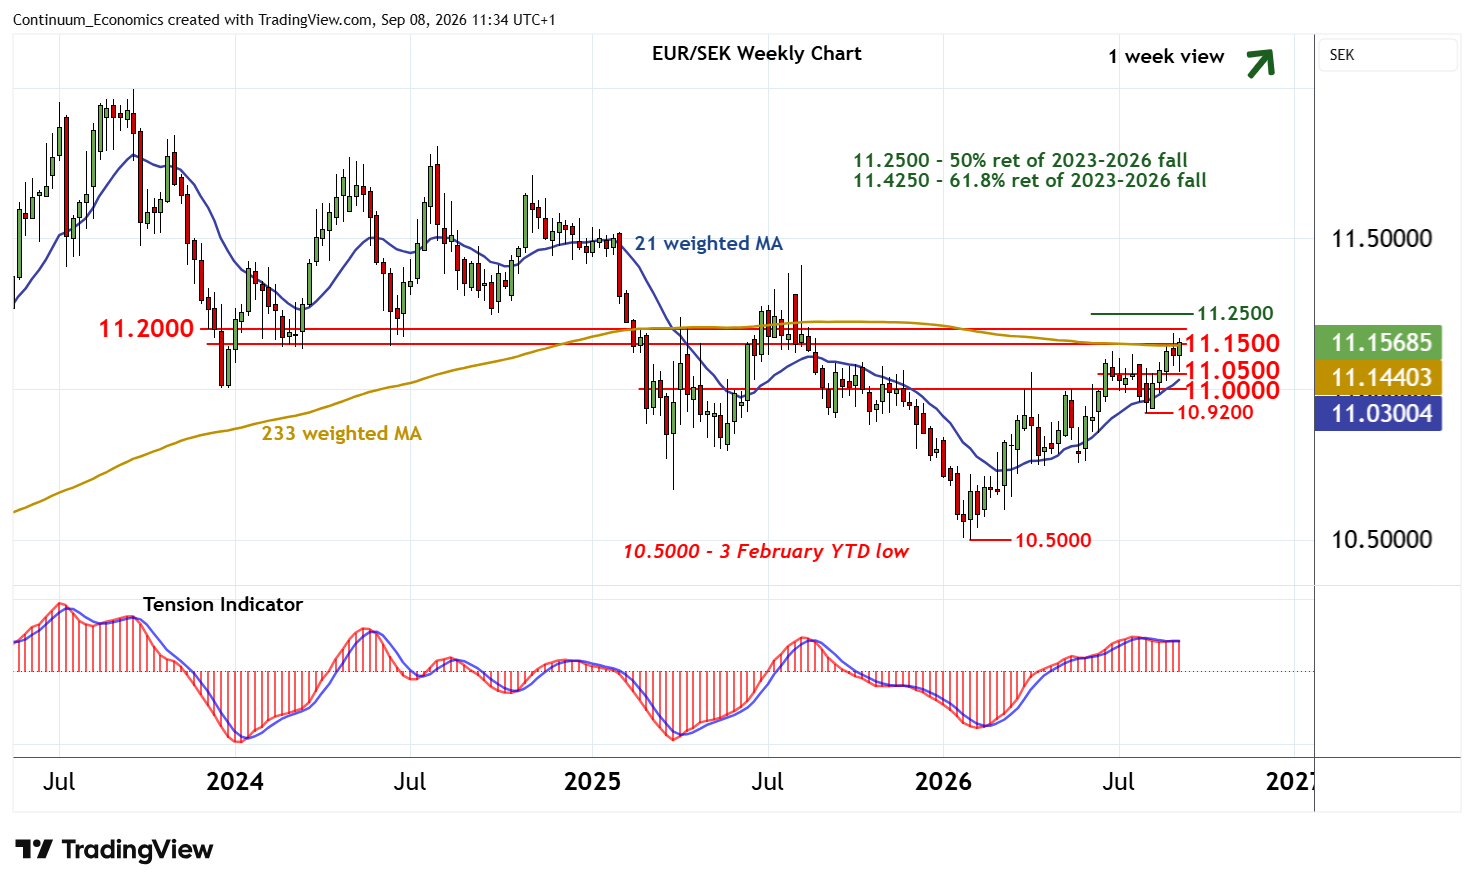
Chart EUR/SEK Update: Choppy at year highs - background studies improving
Anticipated gains have posted a fresh year high around 11.1855
| Levels | Imp | Comment | Levels | Imp | Comment | |||
| R4 | 11.3000 | * | congestion | S1 | 11.1000 | * | congestion | |
| R3 | 11.2500 | ** | 50% ret of 2023-2026 fall | S2 | 11.0500 | * | break level | |
| R2 | 11.2000 | ** | congestion | S3 | 11.0000 | ** | break level | |
| R1 | 11.1855 | * | 2 Sep YTD high | S4 | 10.9200 | ** | 7 Aug (m) low |
Asterisk denotes strength of level
11:05 BST - Anticipated gains have posted a fresh year high around 11.1855, before settling into choppy trade beneath here. Daily stochastics are rising, suggesting room for a test of 11.1855. But the flat daily Tension Indicator is expected to limit initial tests in consolidation, before improving weekly charts prompt a break. A later close above here will improve sentiment and extend February gains initially to congestion around 11.2000. Still higher is the 11.2500 Fibonacci retracement, but already overbought weekly stochastics could limit any initial tests in profit-taking/consolidation, before improving monthly readings prompt further gains.
Meanwhile, support is down to 11.0500. An unexpected break will add weight to sentiment and open up 11.0000, where fresh consolidation is expected to appear.