Published: 2026-06-02T00:45:29.000Z
Chart NZD/USD Update: Settled back from test of .5990 May high
1
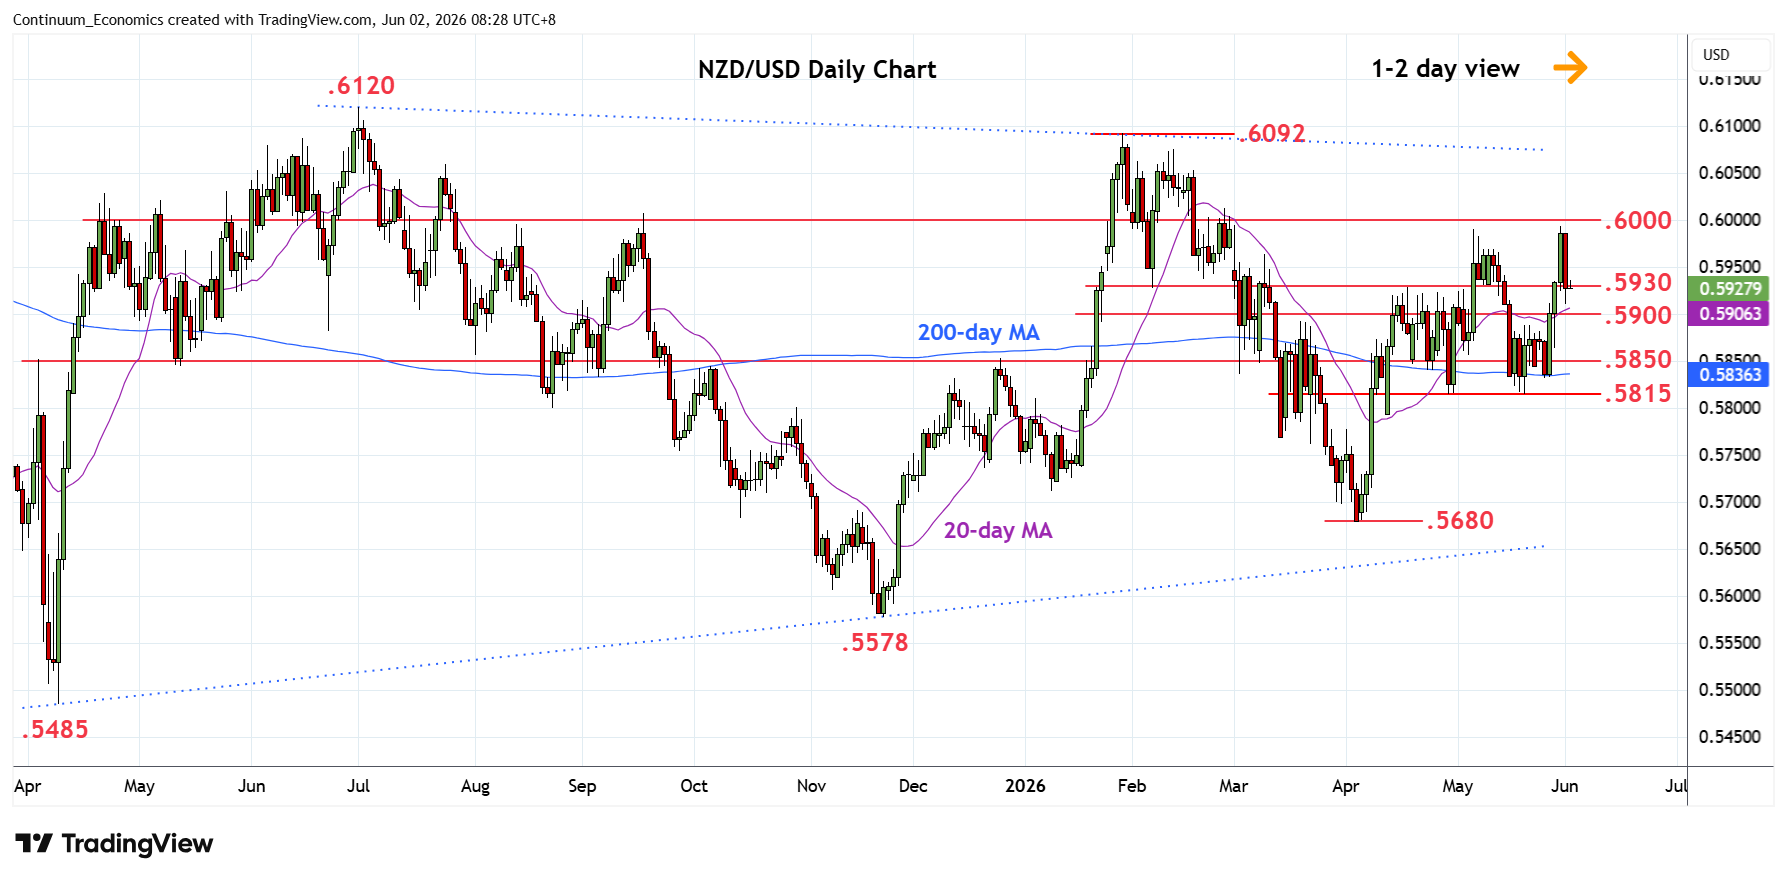
Turned back from test of the .5990 resistance as prices consolidate gains from the .5815 May low
| Levels | Imp | Comment | Levels | Imp | Comment | |||
|---|---|---|---|---|---|---|---|---|
| R4 | .6092 | ** | 29 Jan YTD high | S1 | .5930 | * | Apr high, congestion | |
| R3 | .6050 | * | congestion | S2 | .5900 | * | congestion | |
| R2 | .6000/13 | * | congestion, 26 Feb high | S3 | .5850 | * | congestion | |
| R1 | .5990 | ** | 6 May high | S4 | .5815 | ** | May low |
Asterisk denotes strength of level
00:35 GMT - Turned back from retest of the .5990 resistance as prices consolidate gains from the .5815 May low. Pressure return to support at the .5930/.5900 congestion which should underpin. Would take break here to open up room for further choppy trade back to retest support at the .5850 congestion and the .5815, May low. Meanwhile, resistance remains at the .5990 high. A later break here will extend the April gains and see room to the .6000 figure and .6050 congestion though focus will return to the January current year high at .6092.