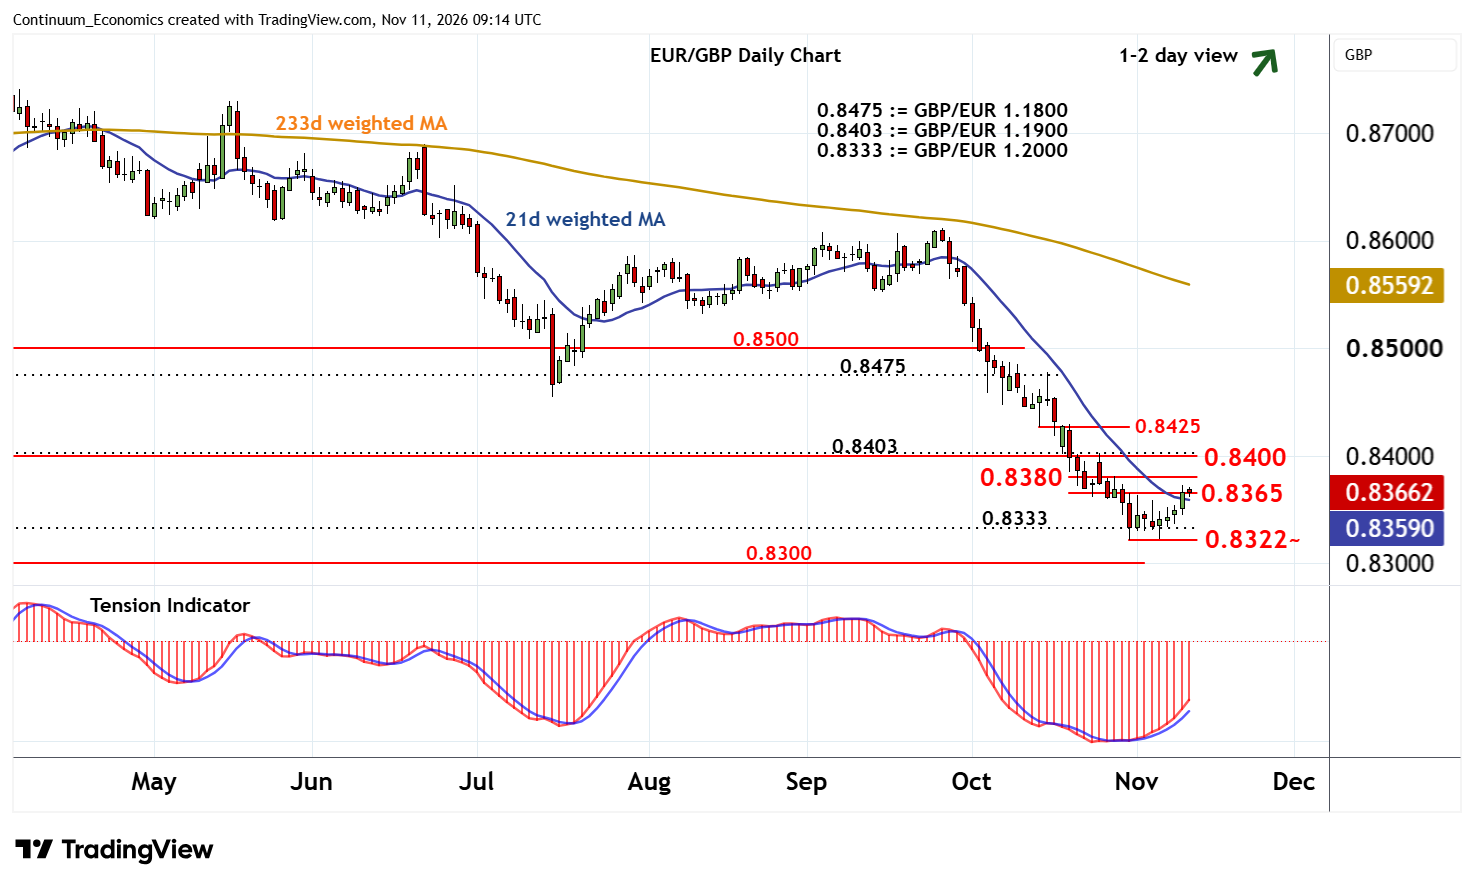
Chart EUR/GBP Update: Drifting higher
The anticipated test of resistance at 0.8365 is giving way to consolidation
| Level | Comment | Level | Comment | |||||
|---|---|---|---|---|---|---|---|---|
| R4 | 0.8425 | break level | S1 | 0.8333 | * | GBP/EUR 1.2000 | ||
| R3 | 0.8400/03 | ** | congestion; GBP/EUR 1.1900 | S2 | 0.8315/22 | * | late-Mar 25 (w) low; 30 Oct YTD low | |
| R2 | 0.8380 | intraday highs | S3 | 0.8300 | * | congestion | ||
| R1 | 0.8365 | intraday break level | S4 | 0.8265 | * | GBP/EUR 1.2100 |
Asterisk denotes strength of level
09:05 GMT - The anticipated test of resistance at 0.8365 is giving way to consolidation, as rising intraday studies and overbought daily stochastics flatten. The daily Tension Indicator continues to rise, however, and oversold weekly stochastics are improving, suggesting room for continuation towards the 0.8380 intraday highs. However, the bearish weekly Tension Indicator and negative longer-term charts should limit any further gains in renewed selling interest towards strong resistance at congestion around 0.8400 and 0.8403, (GBP/EUR 1.1900).
Meanwhile, support remains at 0.8333, (GBP/EUR 1.2000), and extends to the 0.8322 current year low of 30 October. This range should underpin any immediate setbacks.