Published: 2026-06-22T07:31:51.000Z
Chart GBP/USD Update: Choppy trade - studies under pressure
6
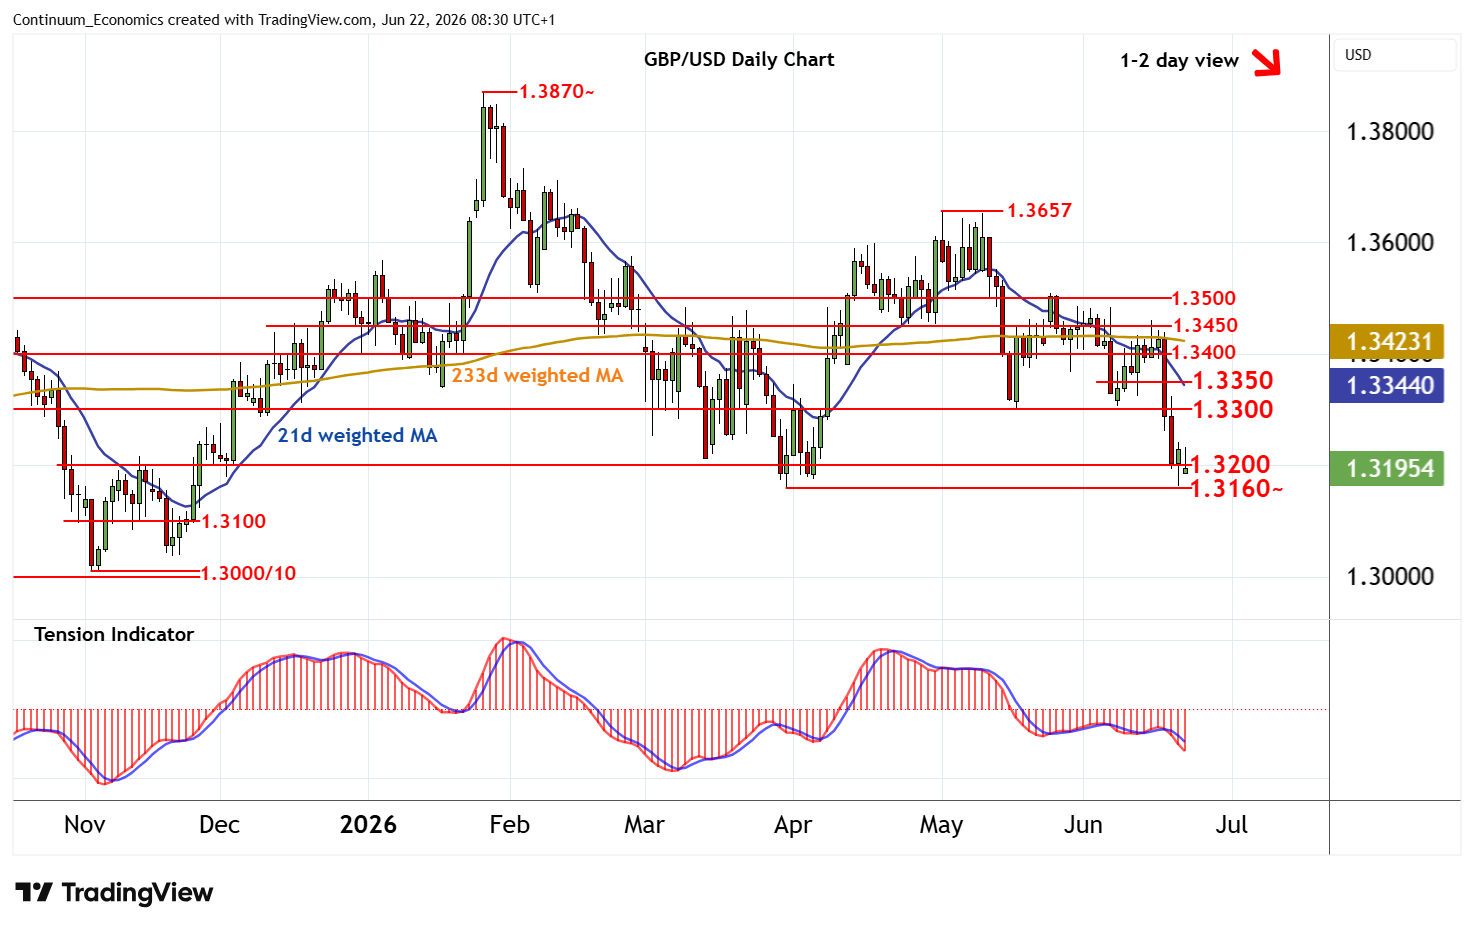
The opening gap below 1.3200 has given way to a bounce
| Level | Comment | Level | Comment | |||||
|---|---|---|---|---|---|---|---|---|
| R4 | 1.3450 | break level | S1 | 1.3200 | ** | congestion | ||
| R3 | 1.3400 | ** | congestion | S2 | 1.3160~ | ** | 31 Mar YTD low | |
| R2 | 1.3350 | break level | S3 | 1.3100 | * | congestion | ||
| R1 | 1.3300 | ** | congestion | S4 | 1.3000/10 | ** | congestion; 4-5 Nov (m) low |
Asterisk denotes strength of level
08:10 BST - The opening gap below 1.3200 has given way to a bounce, as intraday studies continue to rise, with prices currently balanced in choppy trade above here. Oversold daily stochastics are flattening, suggesting potential for further consolidation, before the negative daily Tension Indicator and bearish weekly charts prompt fresh losses. A close below strong support at the 1.3160 current year low of 31 March will add weight to sentiment and extend January losses initially towards congestion around 1.3100. Meanwhile, resistance remains up to congestion around 1.3300 and should cap any immediate tests higher.