USD Rebalancing: Some to EM?

Some portfolios rotations towards EM assets will likely be evident, as we see the USD decline is now extending and broadening. However, flows will likely be selective, both given underwhelming EM performance in the last 5-10 years and the uncertainty over how much Trump will reduce reciprocal tariffs in trade deals. In equities, we prefer India long-term appeal now that 12mth fwd P/E ratio is more in line with bond yields, as China equities have risks around U.S. trade and also 5% nominal GDP growth is curbing corporate earnings growth. In bond markets, India and Mexico have reasonable fiscal trajectory and yield pick-ups, which can attract portfolios. For FX carry trade, Brazil has too high a risk premia and large interest rate differentials, that can help total returns for the remainder of 2025.
Global investors feel that the era of U.S. exceptionalism is over with President Trump’s trade wars. This has started portfolios shifts to other DM countries (here). Can EM countries attract some of the overweight positions in the U.S.?
Figure 1: U.S. and Big EM 2023 Net International Investment Positions/GDP (%)
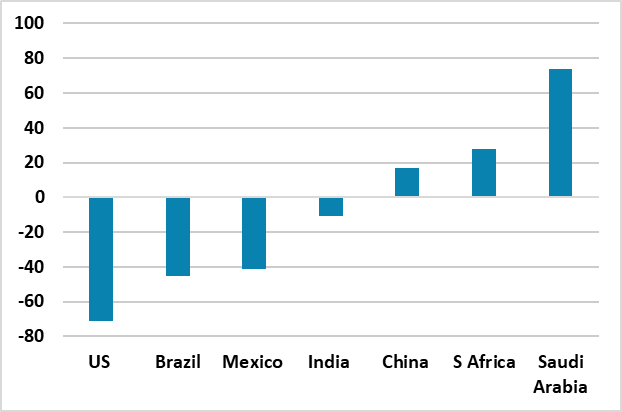 Source: IMF ESR 2024
For big EM countries, the ability to attract global investors depends on domestic fundamentals; how U.S. tariff develops and overall allocation to EM v other DM countries. On the external side, the U.S. chronic current account deficit (Figure 2) is unlikely to be quickly cured by Trump’s trade tariffs, as new factories for import substitution takes many years and settled policies. In contrast, most major EMs’ current account position are not structurally weak. Looking at the net international investment position/GDP (NIIP’s) in Figure 1, the large deficit in the U.S. contrasts with reasonable positions in China and India. Brazil and Mexico have moderately high deficit NIIP to GDP, which would be a concern in a major domestic crisis that prompts capital flight – though current politicians and policies are mainstream and the risk of a major crisis is low in Mexico and medium in Brazil (if inflation and the primary budget deficit are not brought under control).
Figure 2: 2025 Current Account/GDP (%) 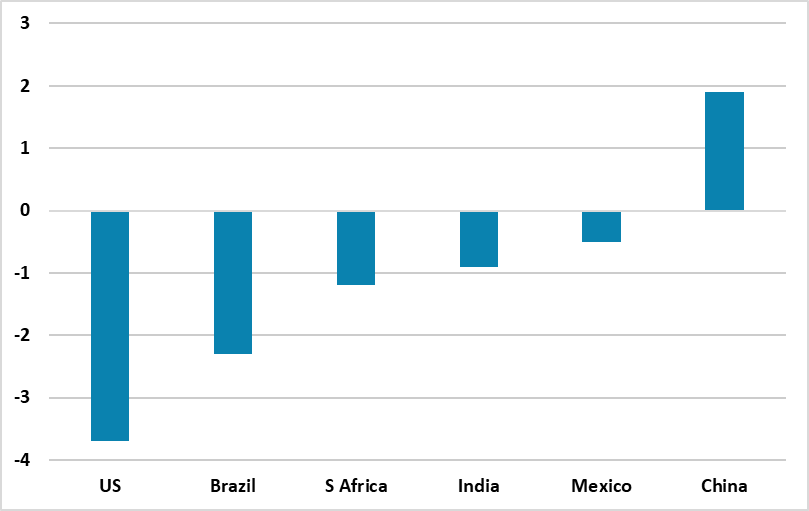 Source: IMF WEO April 2025
In terms of fiscal policy, the U.S. global reserve currency status and deep markets allow it to run a large government debt/GDP than the big EMs can (Figure 3). India benefits from high nominal GDP that helps keep the debt trajectory under control, while bond markets provide some constraint on Brazil and South Africa. However, both countries need to maintain a path towards fiscal consolidation to keep the trust of financial markets and hopefully reduce real yields. China’s gross government debt surge reflects a persistent underlying budget deficit, but has so far been manageable as domestic investors dominate and due to China authorities strong moral suasion to buy central and local government debt. China enjoys U.S. style real yields (Figure 4), but low nominal yields which is not attractive for global portfolios. However, the debt trajectory does leave Chinese authorities reluctant to pursue aggressive fiscal easing like 2009 or 2015.
Figure 3: Gross Government Debt/GDP (%)
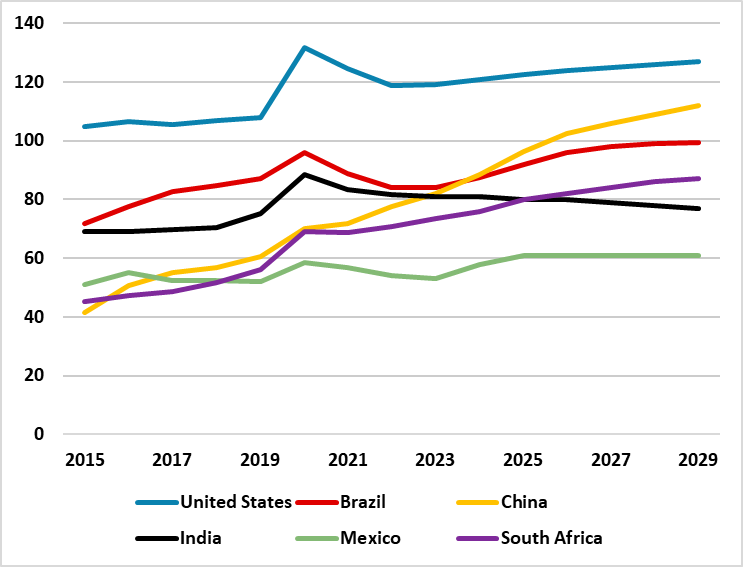 Source: IMF Fiscal Monitor, April 2025
Figure 4: 10yr Government Bond Real Yields using CPI (%) 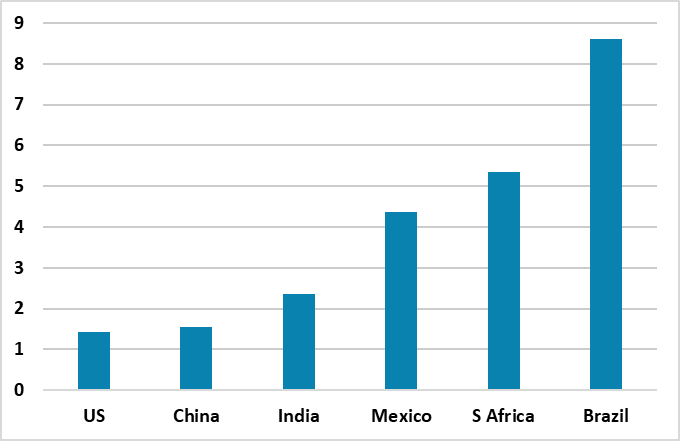 Source: Continuum Economics
Real yields remain high in South Africa and Brazil, though in the latter should come down when the BCB starts an easing cycle. Mexico real yields are reasonable given the lower government debt to GDP trajectory. However, EM fixed income has had higher volatility but not better returns than U.S. corporate debt, which suggests that debt portfolio diversification into EM will likely be a slow process. Ex Mexico and India, big EM debt dynamics could be better, while global central banks see the Euro, Japanese Yen and Gold as the main reserve alternative to the USD. On the margin, India and Mexico government debts could attract some fans looking to diversify away from U.S. Treasuries.
However, nominal and real yield pick-ups could start to attract carry trades at the front-end of the curve, as we expect the USD decline continues and broadens. The 2016-18 carry trade story could have some lessons. Even so, this is likely to be largely yield pick-up and selective in spot terms. China wants a soft Yuan to partially compensate for an adverse trade shock from Trump’s tariffs (we forecast 7.45 by end 2025 (here)) and India FX policy is to avoid any noticeable Indian Rupee appreciation. The Mexican Peso could be interesting if Trump softens further to trade deals, rather than threats and uncertainty. However, the road to trade deals will be bumpy and multi month (here). The Brazilian Real (BRL) is unloved and undervalued, but has lots of carry, and we look for 5.60 on USD/BRL by end 2025. It is also away from the worst of Trump’s trade wars.
Figure 5: USD v Big EM (2016 =100) 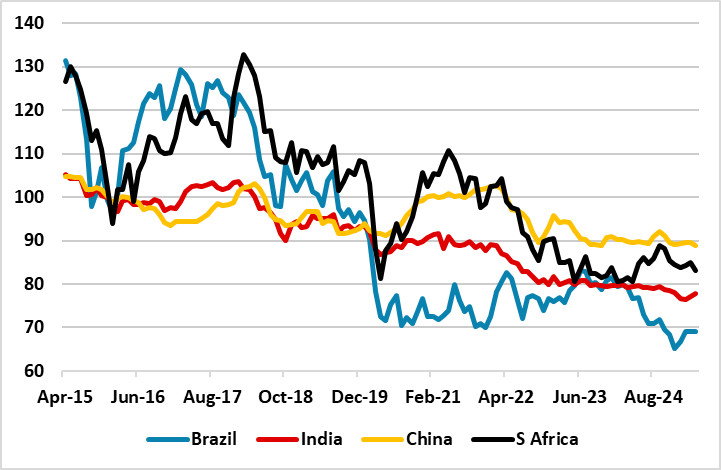 Source: Datastream/Continuum Economics
In equity terms, Indian equities have seen a correction from overvalued levels and the fwd price/earnings ratio is now less overvalued. Additionally, Indian bond yields have edged lower, which means that that 12mth fwd earnings yield to 10yr government bond yield is now back to fair value (Figure 6). India long-term corporate earnings prospects also mean that global investors will likely return in the coming months. Thus we look for Indian equities correction to end in the coming months and outperformance to resume in H2. We see scope to outperform U.S. equities by 10% in the remainder of 2025 and then a further 10% in 2026. The domestic dominance of GDP also makes it a safe haven, while Trump wants to do a trade deal with India. India is now once again our favorite equity market.
Figure 6: India 12mth Fwd Earnings Yield-10yr government Bond Yield (%)
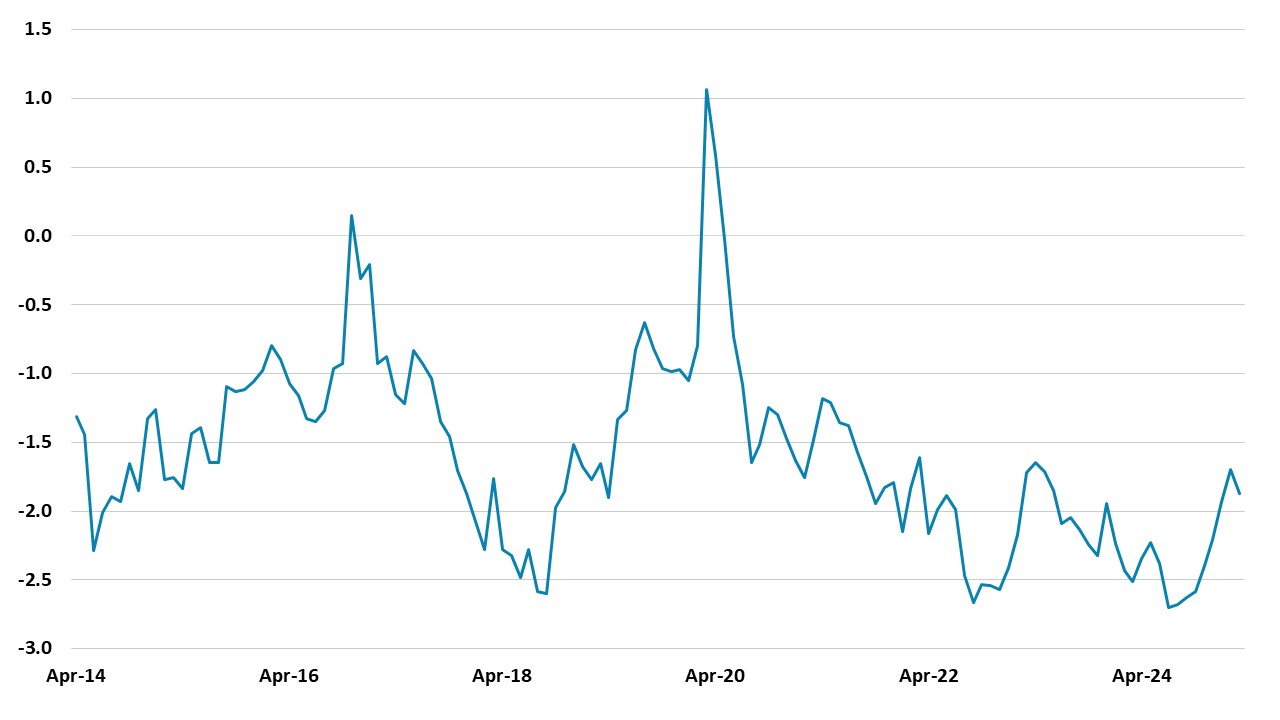
Source: Datastream/Continuum Economics.
Elsewhere in EM equities, the critical question is how much Trump trade implementation is watered down. China equities are no longer cheap versus fwd price/earnings ratios, but are under owned in global equity portfolios. We do foresee a trade truce with the U.S. in weeks that will likely involve postponing extra 125% tariffs and a base of 20%, while negotiations start (here). Even so, we would see the trade negotiations taking at least 6 months and a risk exist of no trade deal and hard reset of U.S./China trade. Additionally, we remain concerned about structural corporate earnings prospects in China with 5% nominal GDP growth (here). The one bright spot is the AI story in China. We could see a further 5% outperformance versus the U.S. by end 2025, but most will come after a revised trade deal is agreed with the U.S. Multi-year we do not see China equities strategically outperforming, given the overhang of the property bust and structural headwinds from population aging and slowing productivity.