Published: 2025-11-11T02:42:28.000Z
Chart USD/THB Update: Consolidating above 32.30/32.23 support
1
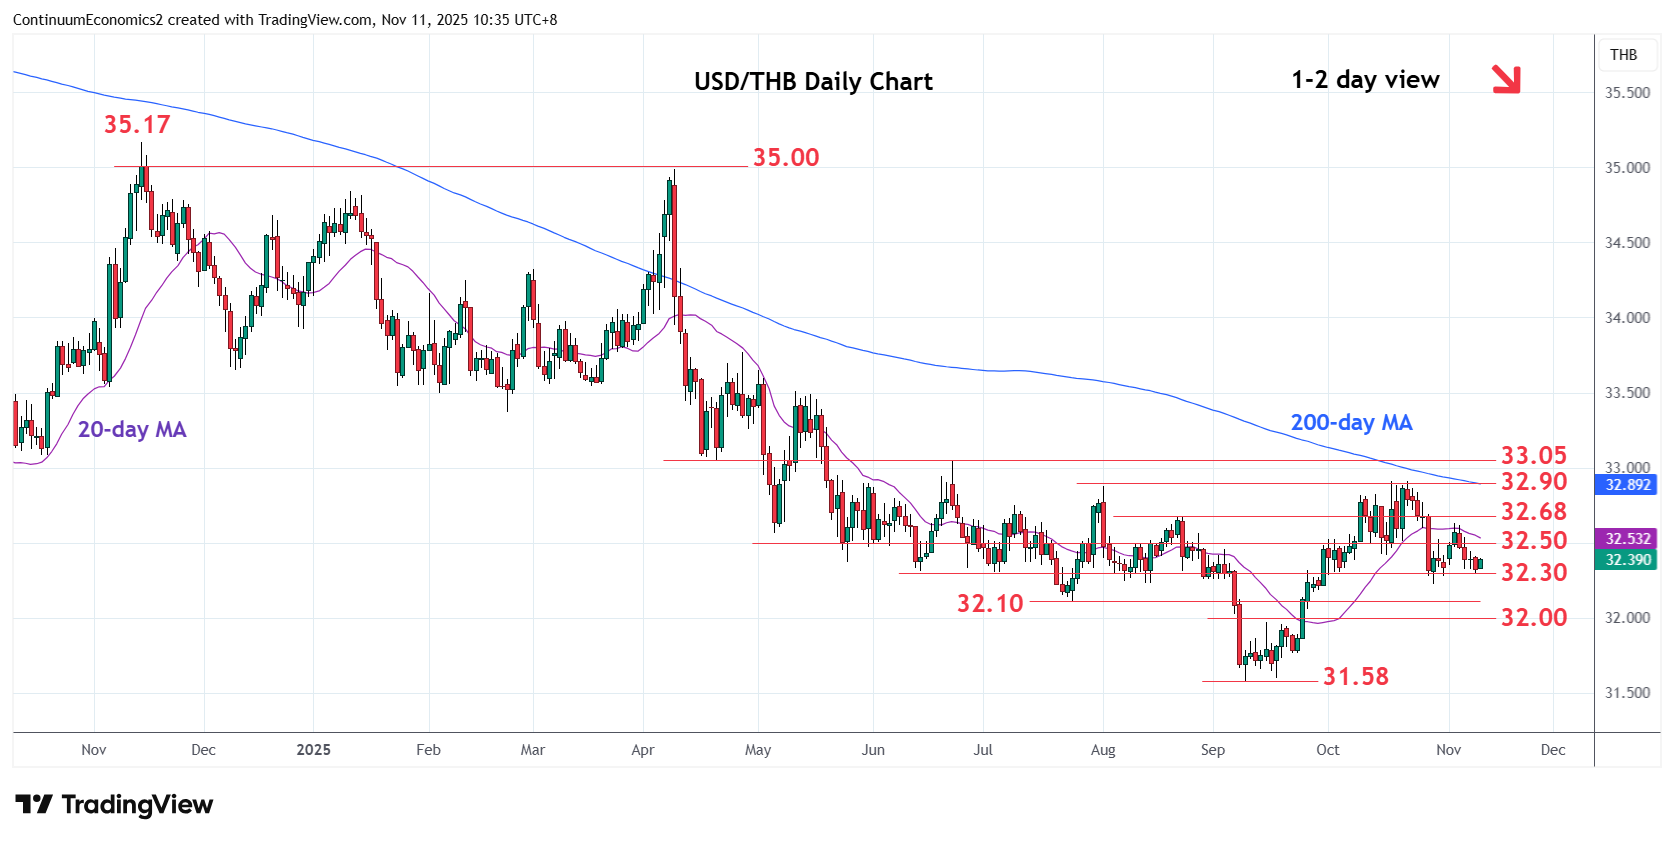
Little change, as prices extend consolidation above support at the 32.30/32.23 area
| Level | Comment | Level | Comment | |||||
|---|---|---|---|---|---|---|---|---|
| R4 | 32.95 | * | 38.2% Nov 2024/Sep fall | S1 | 32.30 | ** | Jun low, congestion | |
| R3 | 32.88 | ** | 1 Aug high, congestion | S2 | 32.23 | * | Oct low | |
| R2 | 32.68 | * | 22 Aug high | S3 | 32.10 | ** | Jul low | |
| R1 | 32.50 | * | congestion | S4 | 32.00 | * | figure |
Asterisk denotes strength of level
02:40 GMT - Little change, as prices extend consolidation above support at the 32.30/32.23 area. However, negative daily and weekly studies suggest this giving way to fresh selling pressure later to extend pullback from the 32.90 high. Lower will open up room for deeper pullback to strong support at the 32.10 July low and the 32.00 figure. Below these will return focus to the 31.58, September current year low. Meanwhile, resistance remains at the 32.50/32.63 area which is expected to cap and sustain losses from 32.90 high.