Published: 2025-11-10T03:19:32.000Z
Chart USD/MYR Update: Extending losses
2
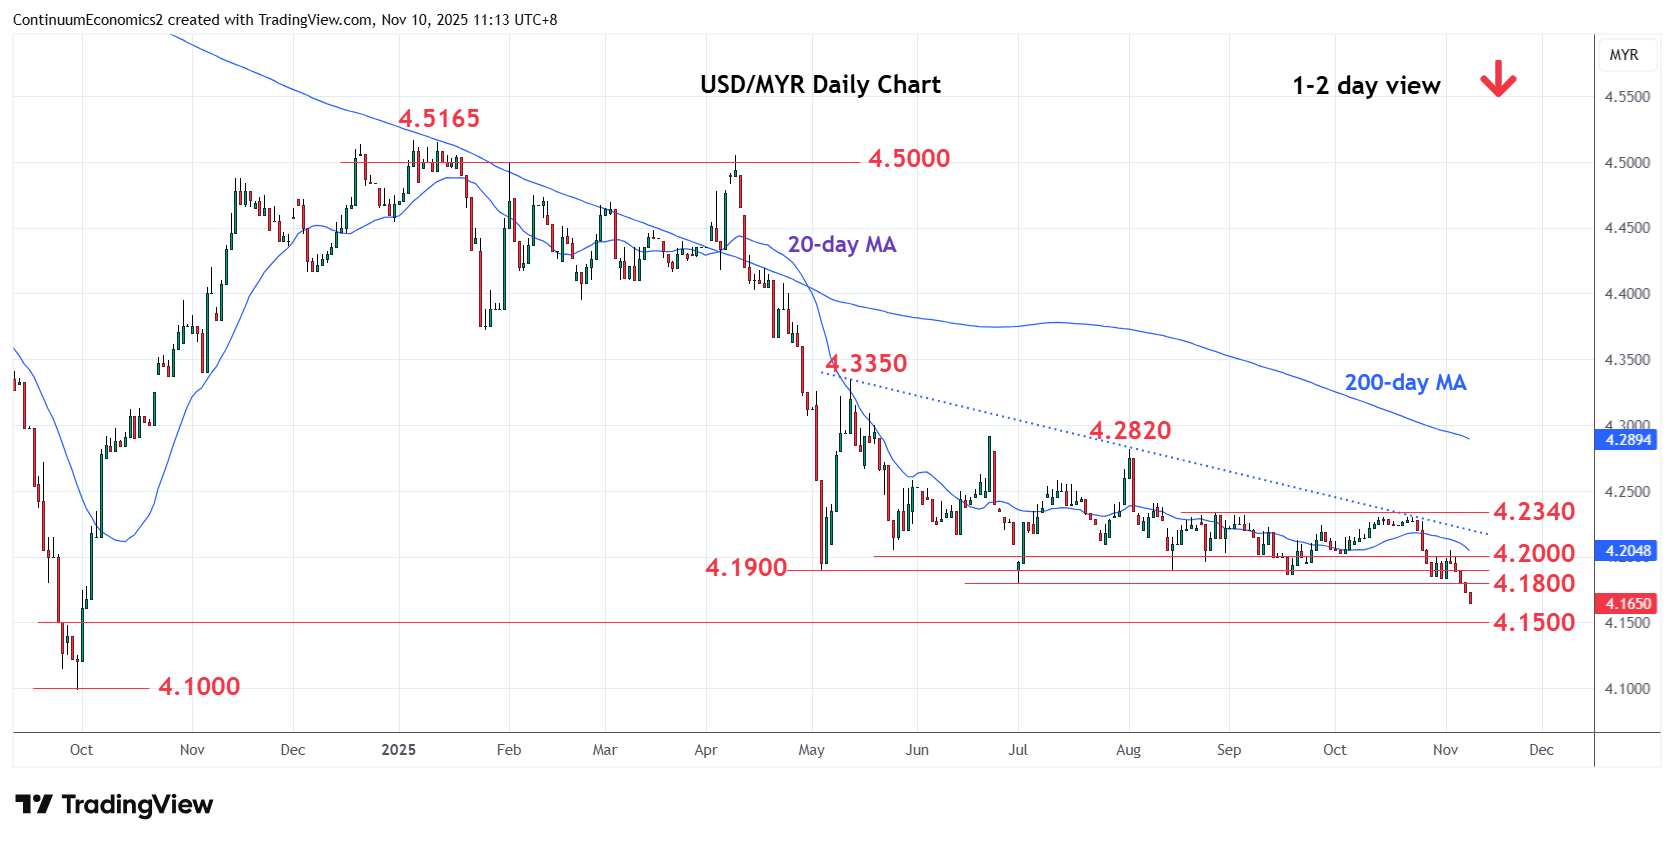
Break of the 4.1900/4.1800 May/July lows see prices extending losses from the 4.2300, October high
| Levels | Imp | Comment | Levels | Imp | Comment | |||
|---|---|---|---|---|---|---|---|---|
| R4 | 4.2300/40 | ** | congestion, 27 Aug high | S1 | 4.1610 | 2 Oct 2024 low | ||
| R3 | 4.2230 | * | 21 Oct low | S2 | 4.1500 | * | congestion | |
| R2 | 4.2000 | * | congestion | S3 | 4.1150 | * | 25 Sep 2024 low | |
| R1 | 4.1800 | * | Jul low | S4 | 4.1000 | ** | Sep 2024 year low |
Asterisk denotes strength of level
03:15 GMT - Break of the 4.1900/4.1800 May/July lows see prices extending losses from the 4.2300, October high. Daily and weekly studies are tracking lower and keep pressure firmly on the downside and see room to extend the broader losses from the 4.5165 January high. Lower will see room to support at the 4.1610 low and 4.1500 congestion. Below this will turn focus to the 4.1000 September 2024 year low. Meanwhile, resistance is lowered to 4.1800/4.2000 July low and congestion area which is expected to cap.