Chart USD Index DXY Update: Consolidating - studies under pressure
Little change, as mixed intraday studies keep near-term sentiment cautious and extend consolidation above support at the 99.50 break level
| Levels | Imp | Comment | Levels | Imp | Comment | |||
|---|---|---|---|---|---|---|---|---|
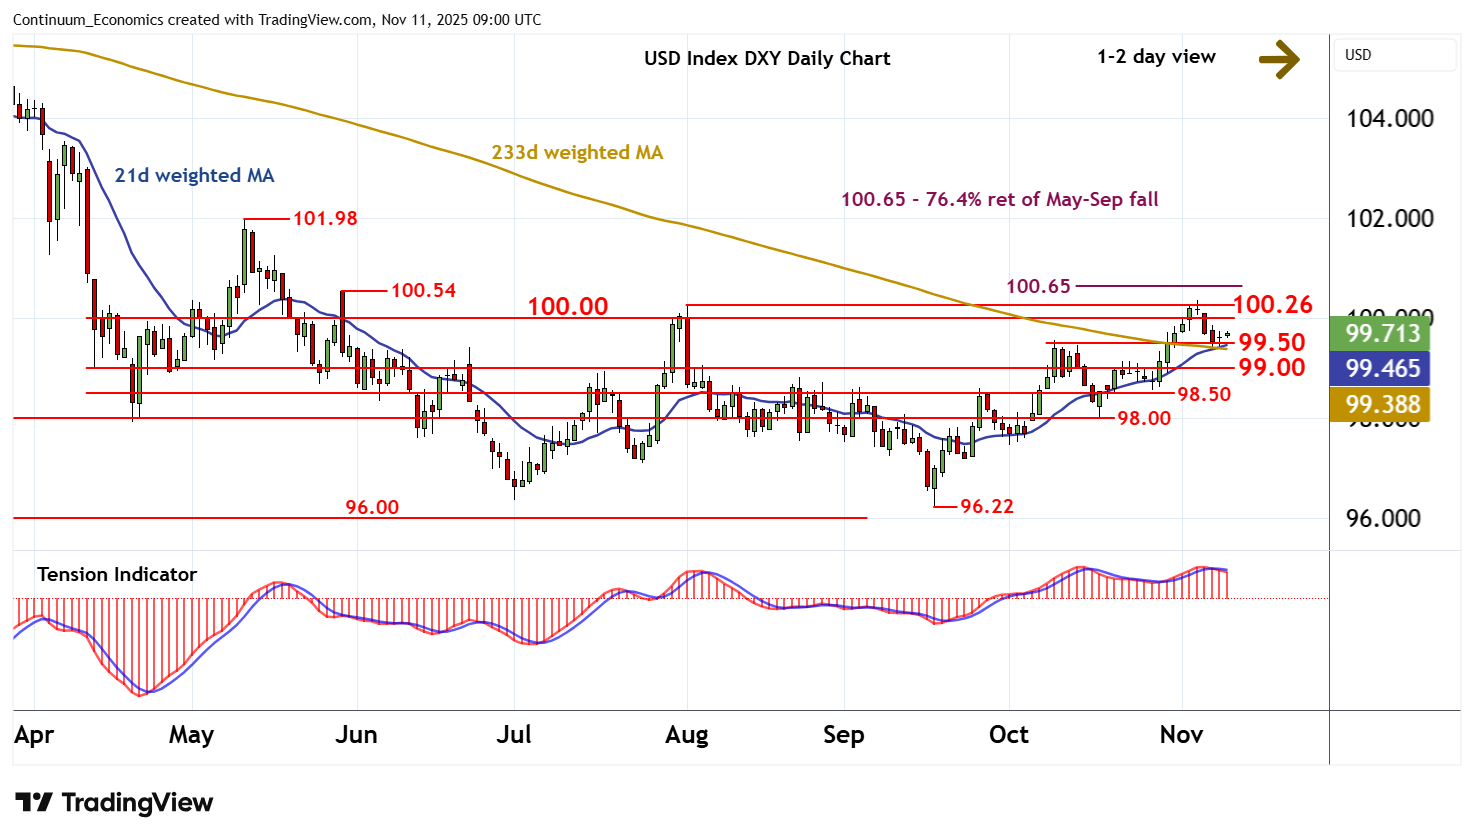
| R4 | 100.65 | ** | 76.4% ret of May-Sep fall | S1 | 99.50 | * | break level | |
| R3 | 100.54 | ** | 29 May (w) high | S2 | 99.00 | * | congestion | |
| R2 | 100.26 | ** | 1 Aug (m) high | S3 | 98.50 | * | congestion | |
| R1 | 100.00 | ** | congestion | S4 | 98.00 | * | congestion |
Asterisk denotes strength of level
08:50 GMT - Little change, as mixed intraday studies keep near-term sentiment cautious and extend consolidation above support at the 99.50 break level. Daily readings are falling and overbought weekly stochastics are flattening, suggesting room for fresh losses in the coming sessions. A break below 99.50 will open up congestion around 99.00. But the rising weekly Tension Indicator should limit any initial tests in short-covering/consolidation. Meanwhile, resistance remains at congestion around 100.00 and extends to the 100.26 monthly high of 1 August. A close above here is needed to improve sentiment and extend mid-September gains initially to the 100.54 weekly high of 29 May and the 100.65 Fibonacci retracement.