Continuum Economics
  • Search
  • About Us
  • Buy
  • Invite A Friend
  • My Basket
  • Articles
  • Calendar
  • Forecasts
  • Events
  • Data
  • Newsletters
  • My Alerts
  • Community
  • Directory
  • About Us
  • Buy
  • Invite A Friend
  • My Basket
  • Articles
    • All
    • Thematic
    • Tactical
    • Asia
    • EMEA
    • Americas
    • Newsletters
    • Freemium
    • Editor's Choice
    • Most Viewed
    • Most Shared
    • Most Liked
  • Calendar
    • Interactive
      • China
      • United States
      • Eurozone
      • United Kingdom
    • Month Ahead
    • Reviews
    • Previews
  • Forecasts
    • Forecasts
    • Key Views
  • Events
    • Media
    • Conference Calls
  • Data
    • Country Insights
    • Shadow Credit Ratings
    • Full CI Data Download
  • Newsletters
  • My Alerts
  • Community
    • FX
    • Fixed Income
    • Macro Strategy
    • Credit Markets
    • Equities
    • Commodities
    • Precious Metals
    • Renewables
  • Directory
  • My Account
  • Notifications Setup
  • Administration Panel
  • Account Details
  • Recent Devices
  • Distribution Lists
  • Shared Free Trials
  • Saved Articles
  • Shared Alerts
  • My Posts
Published: 2025-11-10T12:12:53.000Z

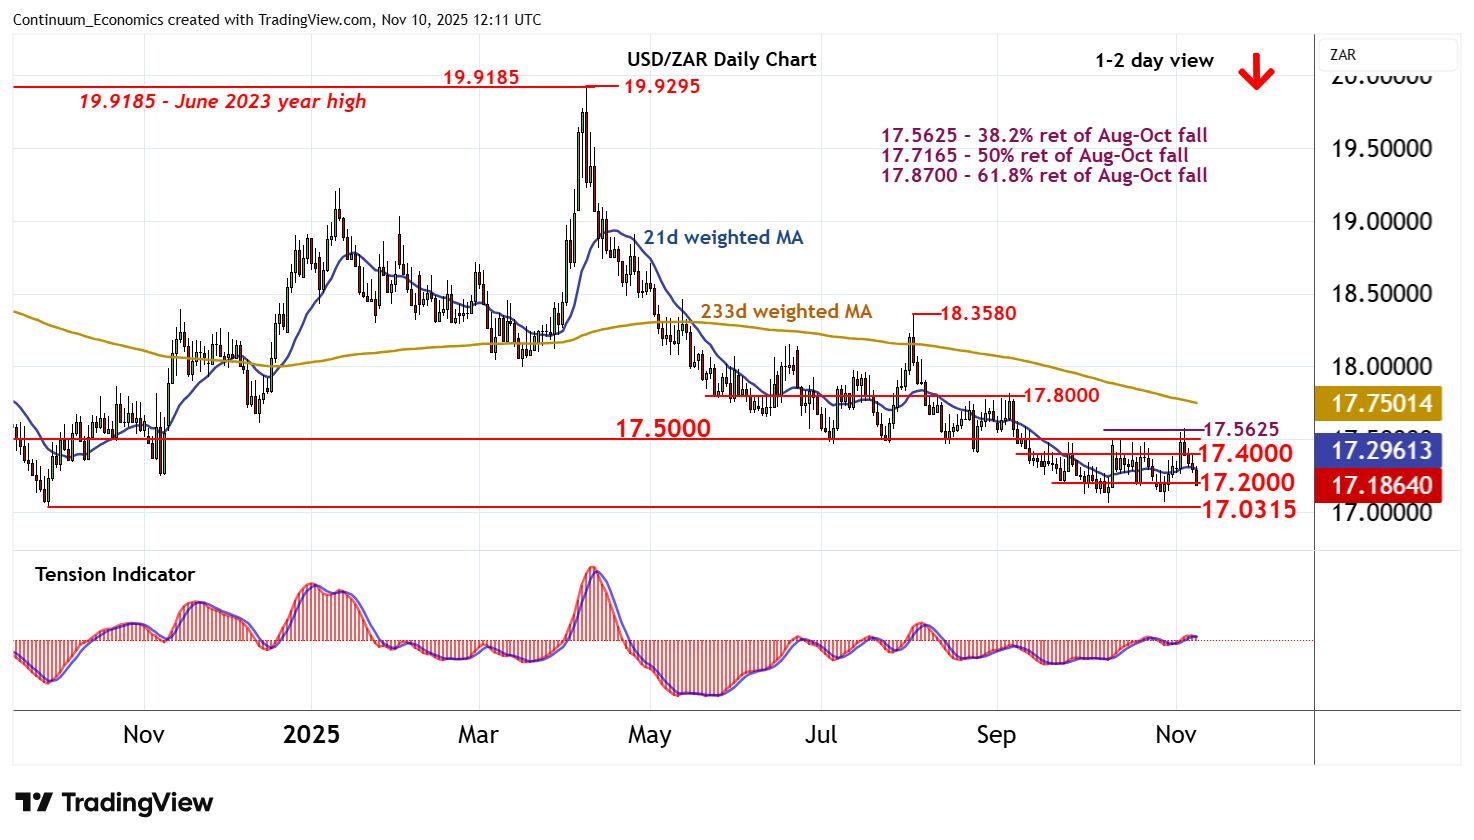
Chart USD/ZAR Update: Extending losses

1

Choppy trade beneath congestion resistance at 17.4000 has given way to the anticipated pullback

 Level Comment  Level Comment
R4 17.8000 break level S1 17.2000*congestion
R3 17.5625**38.2% ret of Aug-Oct fall S2 17.0630*9 Oct YTD low
R2 17.5000**congestion S3 17.0315**30 Sep 2024 (y) low
R1 17.4000*congestion S4 17.0000**congestion

Asterisk denotes strength of level

12:00 GMT - Choppy trade beneath congestion resistance at 17.4000 has given way to the anticipated pullback, as intraday studies turn down, with prices currently trading just below congestion support at 17.2000. Daily readings are under pressure, highlighting room for continuation down to critical support at the 17.0630 current year low of 9 October and the 17.0315 year low of 30 September 2024. But mixed weekly charts should limit any initial tests of this range in further consolidation, before bearish longer-term readings prompt a break. A close beneath here will add weight to sentiment and confirm continuation of May 2023 losses. Meanwhile, resistance remains at congestion around 17.4000 and extends to 17.5000. This range should cap any immediate tests higher.

Continue to read the article for free
Login

or

or

Topics
USD/ZAR-TA
Technical Analysis
EEMEA-Technical

GENERAL

  • Home
  • About Us
  • Our Team
  • Careers

LEGAL

  • Terms and Conditions
  • Privacy Policy
  • Compliance
  • GDPR

GET IN TOUCH

  • Contact Us
Continuum Economics
The Technical Analyst Awards Winner 2021
The Technical Analyst Awards Finalist 2020
image