Published: 2025-11-12T00:55:47.000Z
Chart USD/JPY Update: Pressuring 154.40/48 highs
1
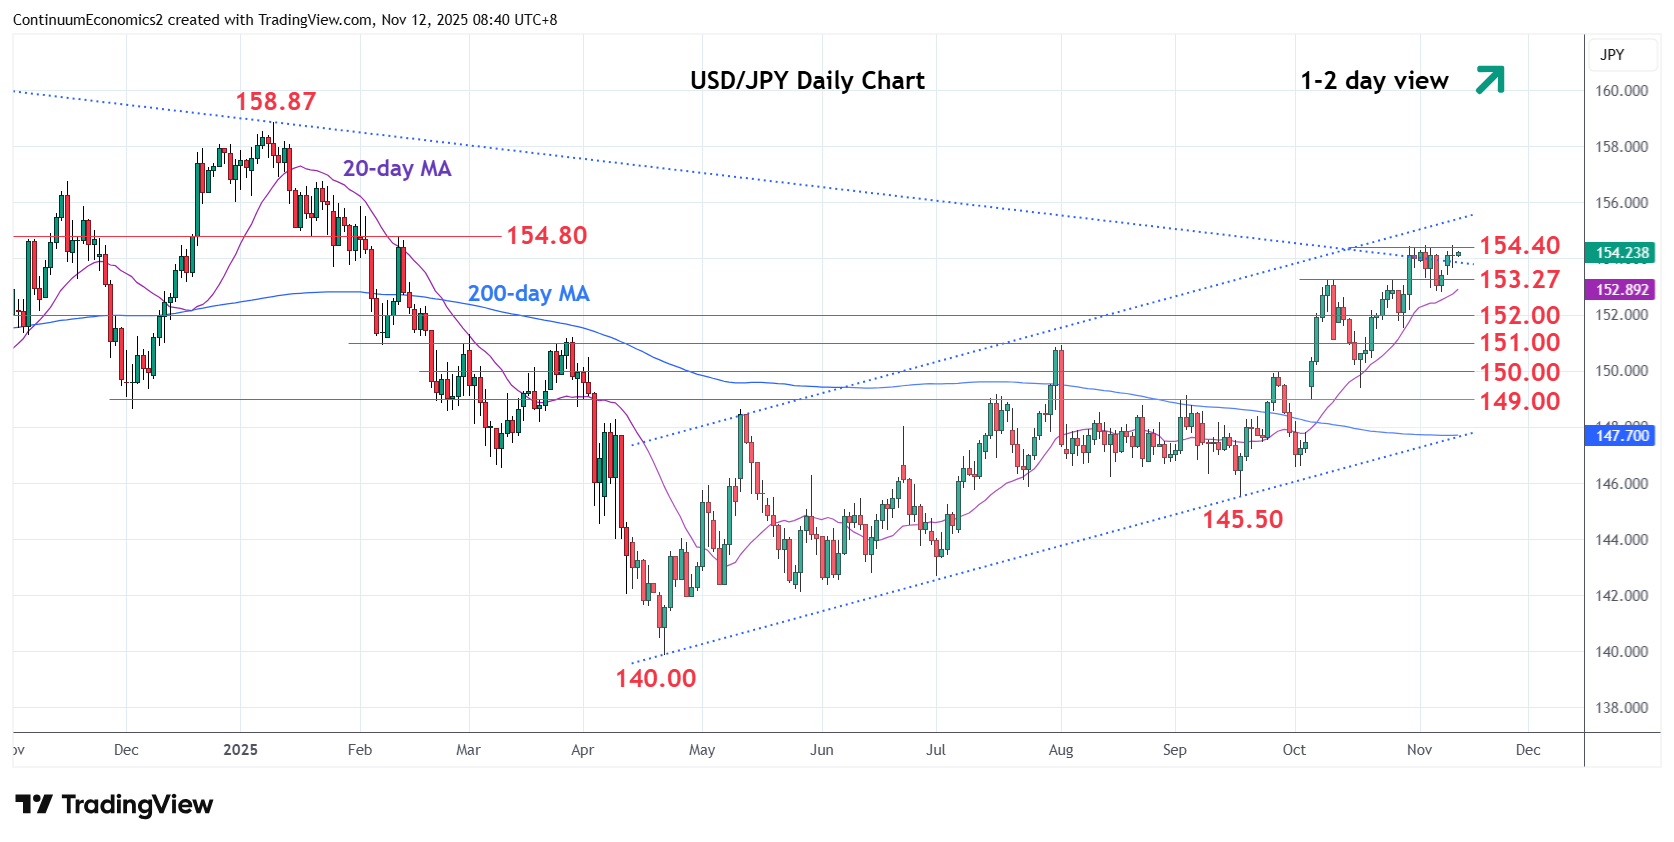
Break above the 154.00 level see prices back to pressure resistance at the 154.40/48 highs
| Levels | Imp | Comment | Levels | Imp | Comment | |||
|---|---|---|---|---|---|---|---|---|
| R4 | 156.00 | * | congestion | S1 | 152.81 | * | 7 Nov low | |
| R3 | 155.00 | * | congestion | S2 | 152.00 | * | congestion | |
| R2 | 154.80 | * | 12 Feb high | S3 | 151.50 | * | congestion | |
| R1 | 154.40/48 | ** | 76.4%, 4 Nov high | S4 | 150.92 | ** | Aug high |
Asterisk denotes strength of level
00:50 GMT - Break above the 154.00 level see prices back to pressure resistance at the 154.40/48 highs. Clearance here will further extend gains within the rising channel from the April low and see scope for extension to the 154.80/155.00 area. However, daily and weekly studies are stretched and caution corrective pullback. Meanwhile, support at the 153.00/152.81 area now underpin. Would take break here to fade the upside pressure and see room for deeper pullback to retrace strong gains from the 145.50, September low.