Chart USD/BRL Update: Room for lower in the coming sessions
The pullback from the 5.5275 weekly high of 13 October has reached 5.3725
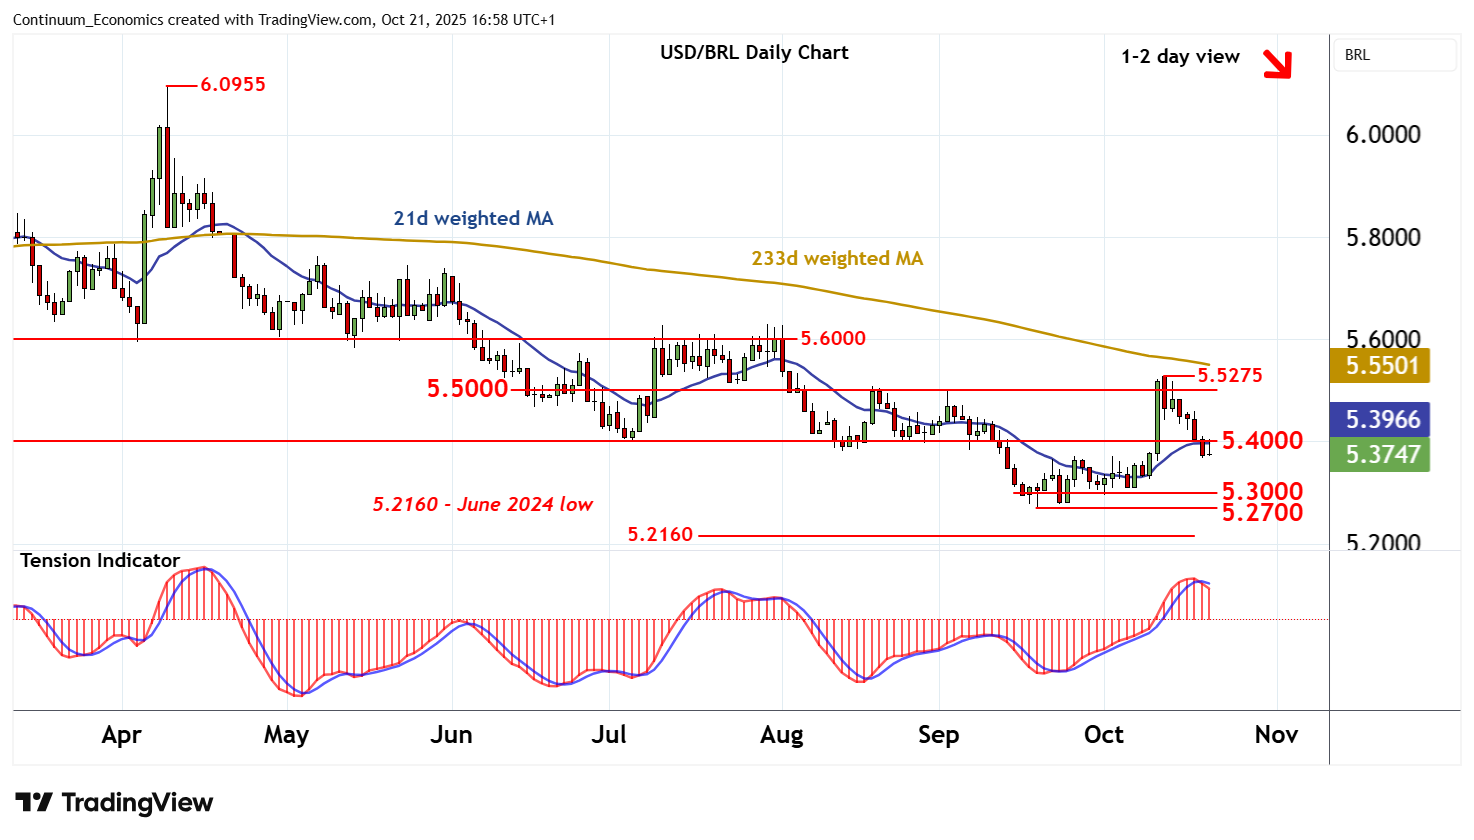
| Levels | Imp | Comment | Levels | Imp | Comment | |||
|---|---|---|---|---|---|---|---|---|
| R4 | 5.6000 | ** | congestion | S1 | 5.3000 | * | congestion | |
| R3 | 5.5275 | * | 13 Oct (w) high | S2 | 5.2700 | ** | 18 Sep YTD low | |
| R2 | 5.5000 | ** | congestion | S3 | 5.2160 | June 2024 low | ||
| R1 | 5.4000 | * | congestion | S4 | 5.2000 | * | congestion |
Asterisk denotes strength of level
16:45 BST - The pullback from the 5.5275 weekly high of 13 October has reached 5.3725, where flat oversold intraday studies are prompting short-term reactions. Daily stochastics and the daily Tension Indicator are falling, highlighting room for continuation towards congestion support at 5.3000. But rising weekly charts should limit any deeper losses in short-covering/consolidation above critical support at the 5.2700 current year low of 18 September. A close beneath here would turn sentiment negative and extend December 2024 losses towards 5.2000. Meanwhile, a close back above congestion resistance at 5.4000 would help to stabilise price action and prompt consolidation beneath further congestion around 5.5000.