Published: 2024-10-29T13:06:15.000Z
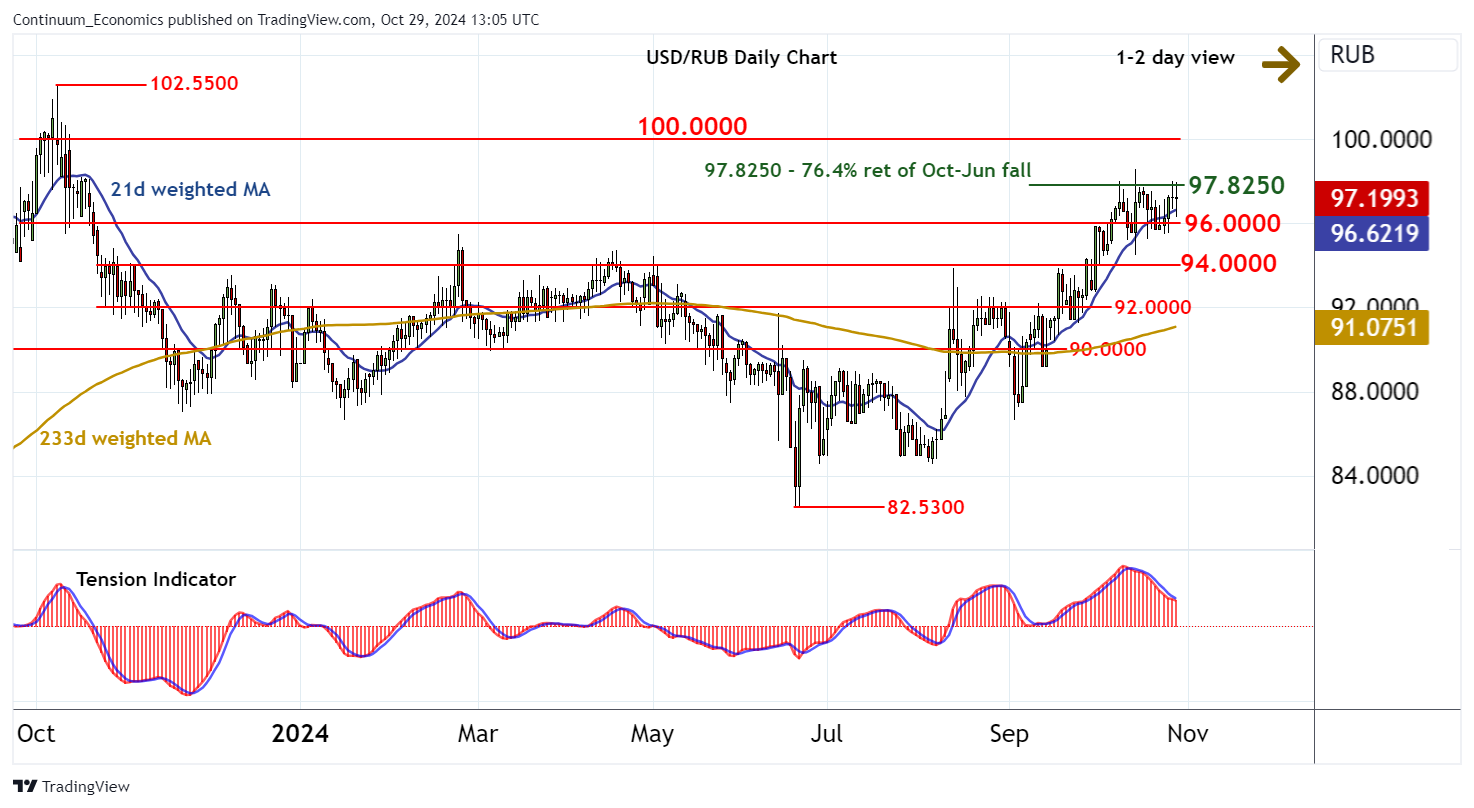
Chart USD/RUB Update: Further consolidation

Senior Technical Strategist
-
Still little change, as price action extends choppy trade within the 96.0000 - 97.8250 area

| Levels | Comment | Levels | Comment | |||||
| R4 | 102.5500 | ** | 9 Oct 2023 (m) high | S1 | 96.0000 | * | congestion | |
| R3 | 100.0000 | ** | congestion | S2 | 94.0000 | * | break level | |
| R2 | 98.5750 | 15 Oct YTD high | S3 | 92.0000 | ** | congestion | ||
| R1 | 97.8250 | ** | 76.4% ret of Oct-Jun fall | S4 | 90.0000 | ** | congestion |
Asterisk denotes strength of level
12:50 BST - Still little change, as price action extends choppy trade within the 96.0000 - 97.8250 area. The daily Tension Indicator is leaning lower, suggesting further sideways trade. But a tick higher in daily stochastics and mixed/positive weekly charts highlight potential for a further gains in the coming sessions. A close above the 97.8250 Fibonacci retracement is needed to turn sentiment positive and extend June gains towards strong resistance at 100.00. Meanwhile, a close below congestion support at 96.0000 would turn price action cautiously negative and open up support at the 94.0000 break level.