Chart USD Index DXY Update: Further consolidation - studies under pressure
The anticipated break below support at 99.50 has bounced from 99.30~
| Levels | Imp | Comment | Levels | Imp | Comment | |||
|---|---|---|---|---|---|---|---|---|
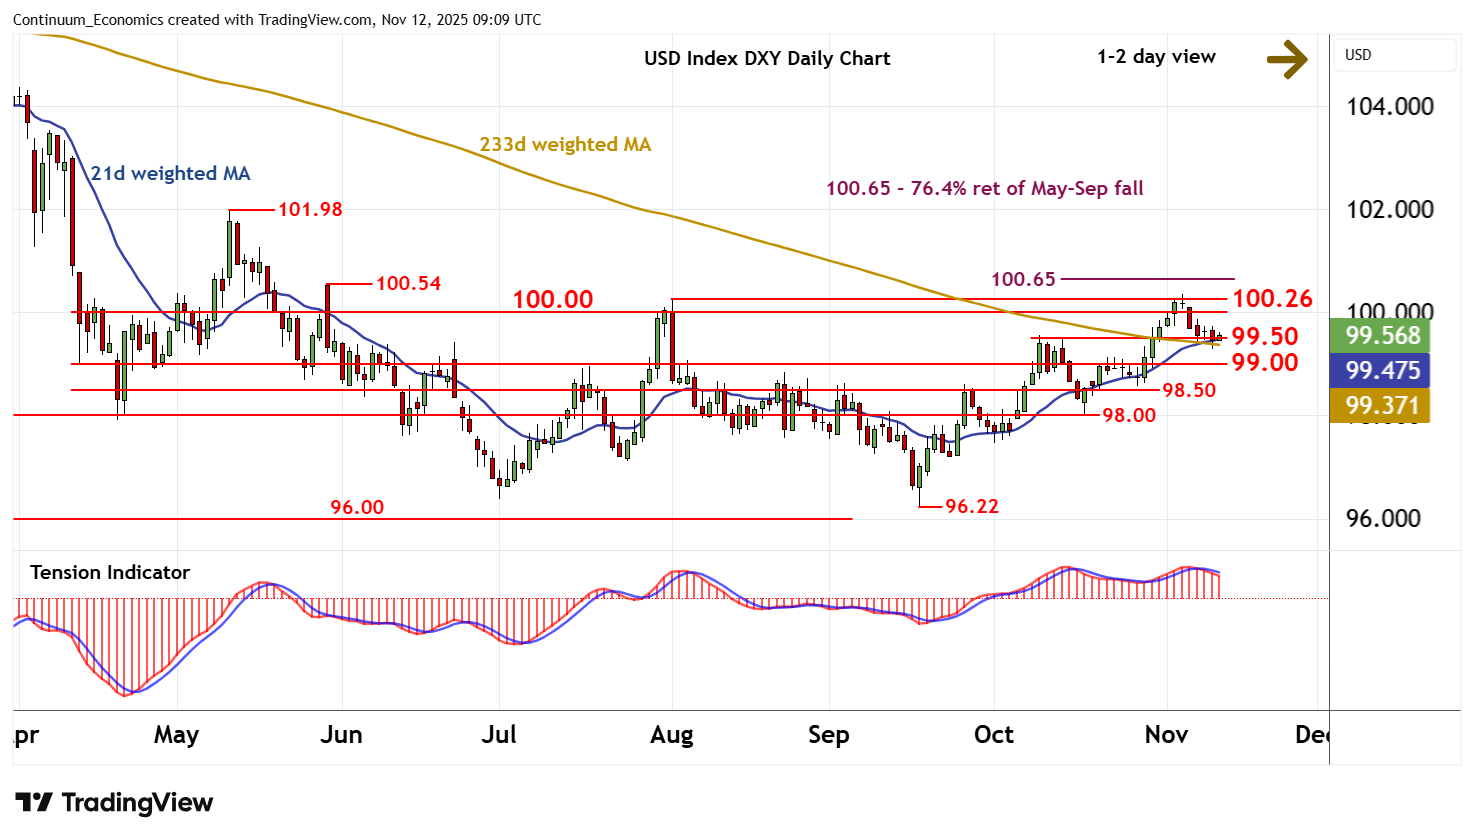
| R4 | 100.65 | ** | 76.4% ret of May-Sep fall | S1 | 99.50 | * | break level | |
| R3 | 100.54 | ** | 29 May (w) high | S2 | 99.00 | * | congestion | |
| R2 | 100.26 | ** | 1 Aug (m) high | S3 | 98.50 | * | congestion | |
| R1 | 100.00 | ** | congestion | S4 | 98.00 | * | congestion |
Asterisk denotes strength of level
08:55 GMT - The anticipated break below support at 99.50 has bounced from 99.30~, as intraday studies turn higher, with prices once again trading above 99.50. Daily readings continue to fall and overbought weekly stochastics are flattening, suggesting room for fresh losses in the coming sessions. A break back below 99.50 will open up congestion around 99.00. But the rising weekly Tension Indicator should limit any initial tests in short-covering/consolidation. Meanwhile, resistance remains at congestion around 100.00 and extends to the 100.26 monthly high of 1 August. A close above here is needed to improve sentiment and extend mid-September gains initially to the 100.54 weekly high of 29 May and the 100.65 Fibonacci retracement.