Published: 2025-11-12T02:13:48.000Z
Chart USD/SGD Update: Consolidating test of 1.3000 level
-
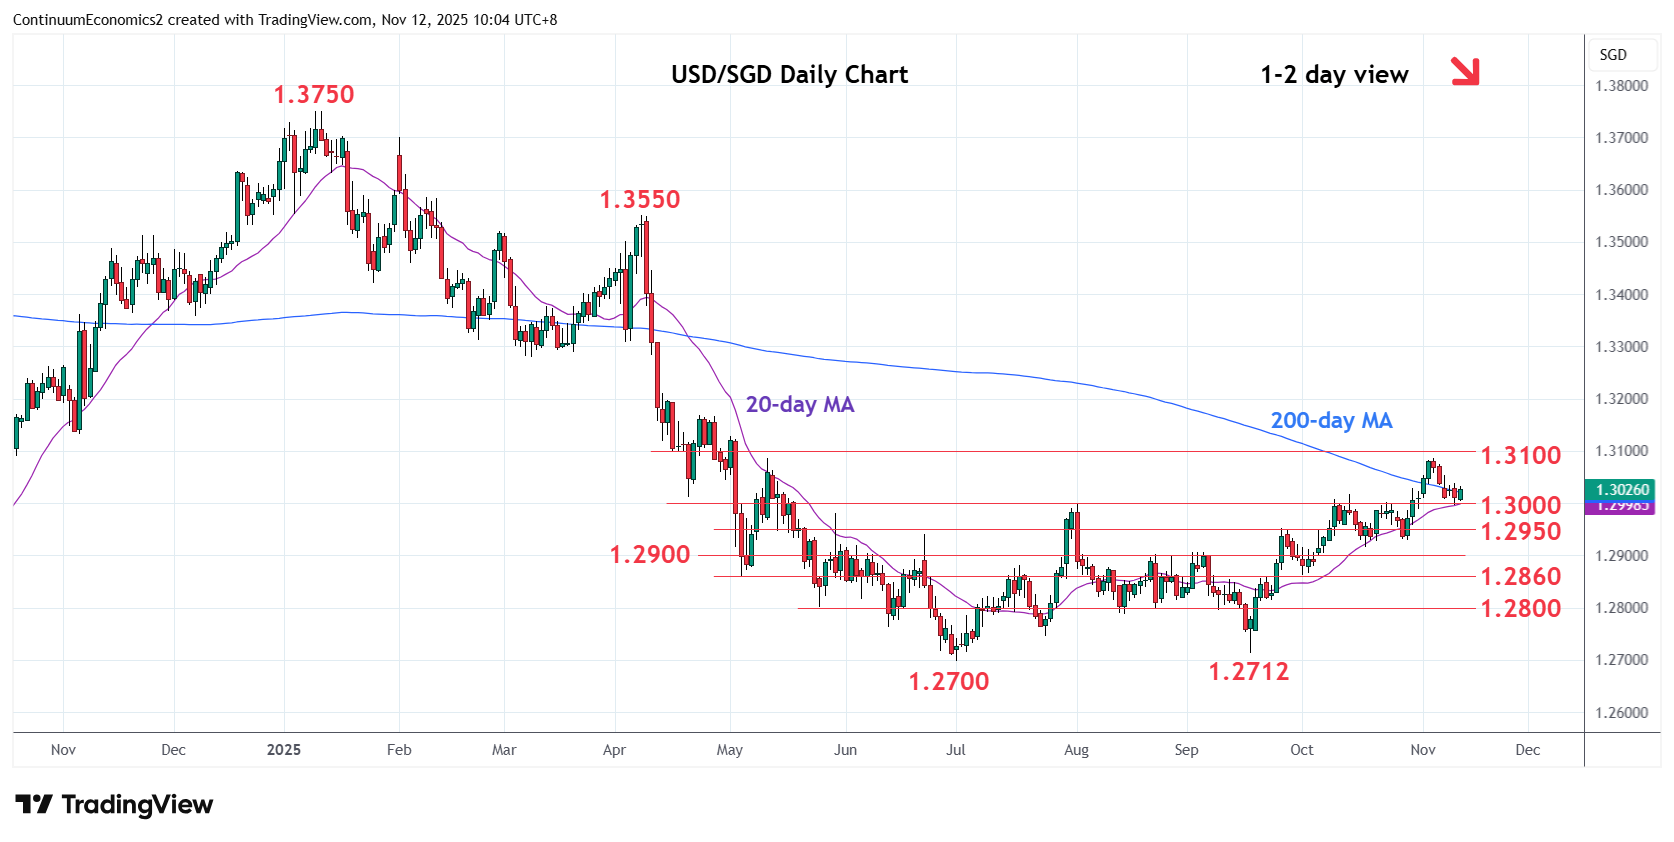
Test of the 1.3000 level has given way to bounce as prices consolidate pullback from the 1.3085 resistance
| Level | Comment | Level | Comment | ||||
|---|---|---|---|---|---|---|---|
| R4 | 1.3170 | * | 23 Apr high | S1 | 1.3000 | * | Aug high, congestion |
| R3 | 1.3130 | * | May high | S2 | 1.2950 | * | Sep high |
| R2 | 1.3100 | * | 38.2% Jan/Jul fall | S3 | 1.2930 | * | 29 Oct low |
| R1 | 1.3085 | * | 12 May high | S4 | 1.2917/00 | ** | 17 Oct low, congestion |
Asterisk denotes strength of level
02:10 GMT - Test of the 1.3000 level has given way to bounce as prices consolidate pullback from the 1.3085 resistance and unwind oversold intraday studies. Negative daily studies suggest consolidation giving way to fresh selling pressure later to extend rejection from the 1.3085/1.3100 resistance. Break will see room for deeper pullback to retrace rally from the 1.2712 low of September to the 1.2950 support. Below this will turn focus to strong support at 1.2930 and 1.2917 lows. Meanwhile, resistance at the 1.3085/1.3100 area is expected to cap.