Published: 2024-10-31T08:26:36.000Z
Chart GBP/USD Update: Break above 1.3000 not sustained

Senior Technical Strategist
2

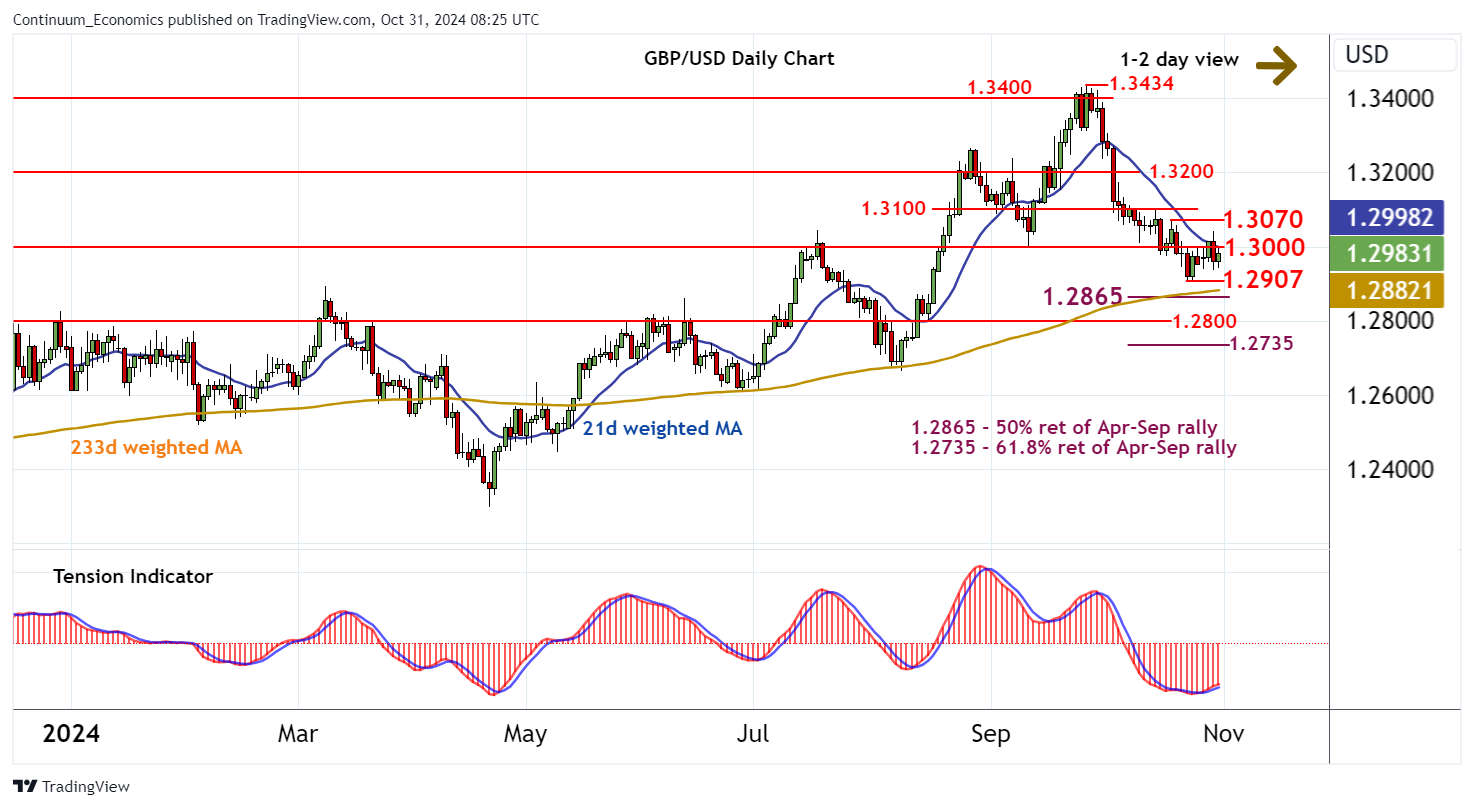
The anticipated break above congestion resistance at 1.3000 failed to reached the 1.3070 weekly high of 18 October

| Level | Comment | Level | Comment | |||||
|---|---|---|---|---|---|---|---|---|
| R4 | 1.3100 | * | congestion | S1 | 1.2907 | * | 23 Oct (w) low | |
| R3 | 1.3070 | * | 18 Oct (w) high | S2 | 1.2865 | ** | 50% ret of Apr-Sep rally | |
| R2 | 1.3043 | 30 Oct high | S3 | 1.2800 | ** | congestion | ||
| R1 | 1.3000 | ** | congestion | S4 | 1.2735 | ** | 61.8% ret of Apr-Sep rally |
Asterisk denotes strength of level
08:05 GMT - The anticipated break above congestion resistance at 1.3000 failed to reached the 1.3070 weekly high of 18 October, with prices falling back from 1.3043 into fresh consolidation beneath 1.3000. Rising daily stochastics are overbought and the rising daily Tension Indicator is showing early signs of flattening, suggesting difficulty sustaining any fresh tests above 1.3000. In the coming sessions, consolidation is highlighted, with support down to the 1.2907weekly low of 23 October. Broader weekly charts are under pressure, but a close beneath here is needed to turn sentiment negative and extend September losses initially to the 1.2865 Fibonacci retracement.