Chart USD/CAD Update: Leaning lower in range
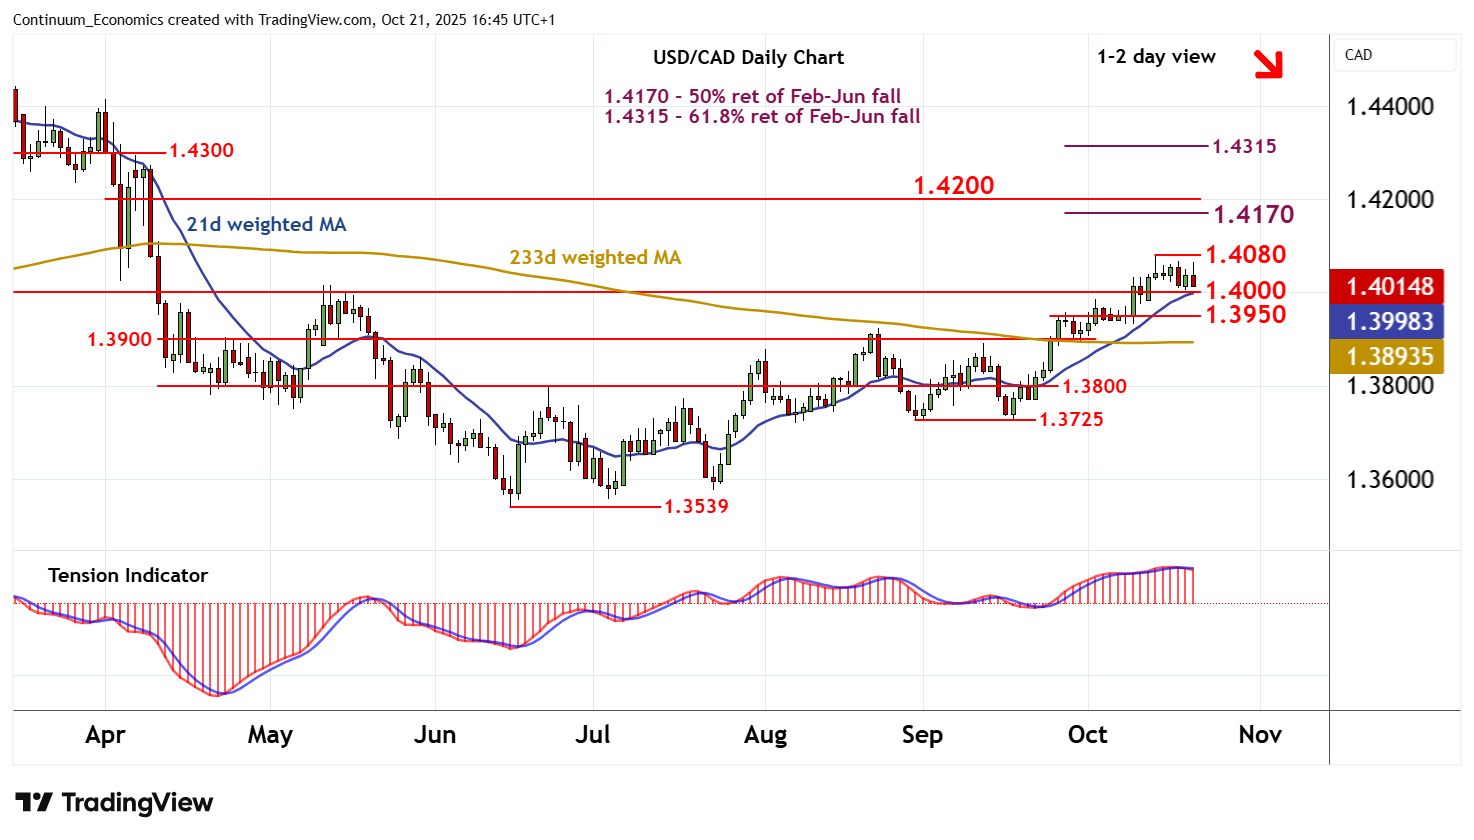
Still little change, as prices extend consolidation within the 1.4000 - 1.4080 range
| Levels | Imp | Comment | Levels | Imp | Comment | |||
|---|---|---|---|---|---|---|---|---|
| R4 | 1.4300 | * | congestion | S1 | 1.4000 | * | break level | |
| R3 | 1.4200 | ** | break level | S2 | 1.3950 | * | pivot | |
| R2 | 1.4170 | ** | 50% ret of Feb-Jun fall | S3 | 1.3900 | ** | break level | |
| R1 | 1.4080 | ** | 14 Oct (w) high | S4 | 1.3800 | * | congestion |
Asterisk denotes strength of level
16:10 BST - Still little change, as prices extend consolidation within the 1.4000 - 1.4080 range. Daily stochastics and the daily Tension Indicator are under pressure, highlighting room for a drift lower, with support at 1.4000 to attract. Overbought weekly stochastics are also flattening, suggesting room for a break beneath here towards 1.3950. But the rising weekly Tension Indicator should limit any initial tests in fresh consolidation. Following cautious trade, higher levels are looked for. However, a close above the 1.4080 weekly high of 14 October is needed to turn sentiment positive and extend June gains towards the 1.4170 Fibonacci retracement.