Published: 2025-11-11T00:24:21.000Z
Chart AUD/USD Update: Extending bounce from .6458 low
1
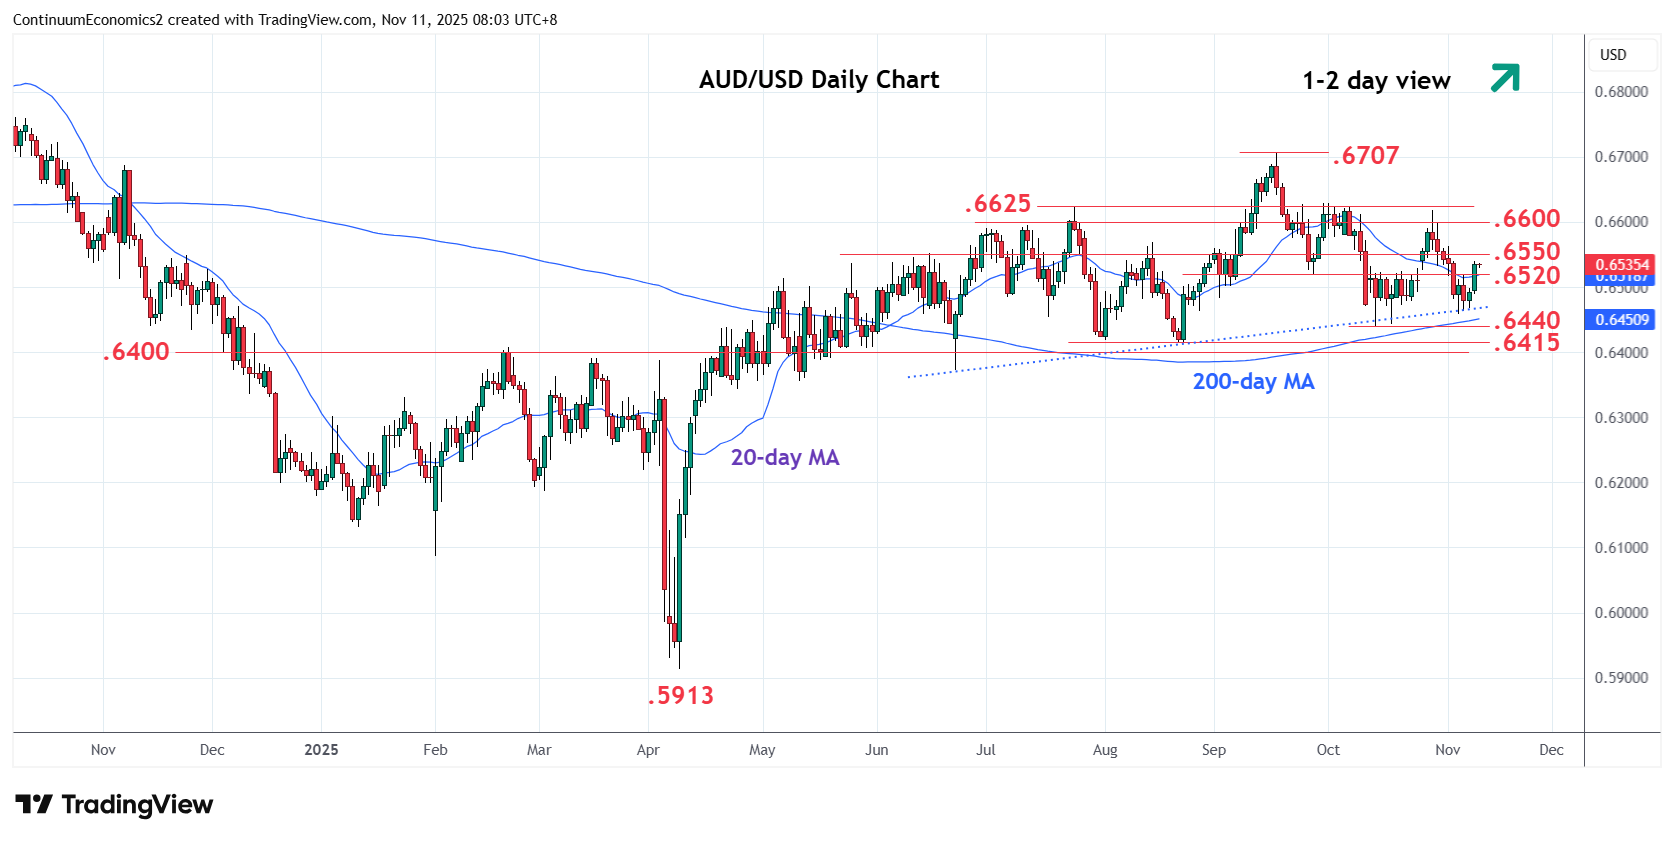
Consolidation has given way to break of the .6520 resistance to extend bounce from the .6458 low
| Levels | Imp | Comment | Levels | Imp | Comment | |||
|---|---|---|---|---|---|---|---|---|
| R4 | 0.6707 | ** | 17 Sep YTD high | S1 | 0.6500 | * | congestion | |
| R3 | 0.6625/30 | ** | Jul, Oct highs | S2 | 0.6458 | * | 5 Nov low | |
| R2 | 0.6600 | * | congestion | S3 | 0.6440 | ** | Oct low | |
| R1 | 0.6550 | * | congestion | S4 | 0.6415/00 | ** | Aug low, congestion |
Asterisk denotes strength of level
00:10 GMT - Consolidation has given way to break of the .6520 resistance to extend bounce from the .6458 low and sustain bullish structure from the April low. Focus now turn to the .6550 resistance with positive daily studies suggesting potential for break here to set up scope for retest of the .6600 level and the .6625/30 highs. Meanwhile, support is raised to the .6500 level which should underpin and sustain bounce from the .6458 low. Only below the latter will threaten critical support at .6440/.6415, October/August lows.