Published: 2024-11-07T05:19:40.000Z
Chart USD/INR Update: Extending sharp gains

Technical Analyst
-
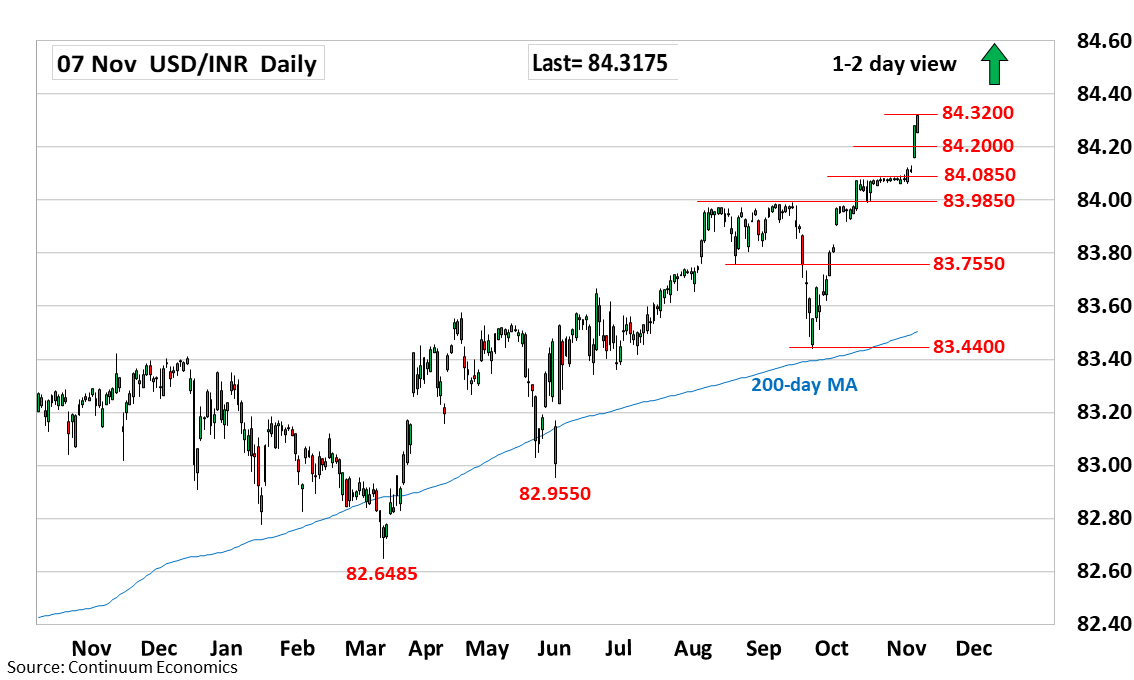
Extending parabolic rally following break of the 84.0850/84.0950 October highs, to reach fresh all-time high at 84.3200

| Level | Comment | Level | Comment | |||||
|---|---|---|---|---|---|---|---|---|
| R4 | 84.7800 | projection | S1 | 84.2000 | * | figure | ||
| R3 | 84.5000 | figure | S2 | 84.1600 | * | 6 Nov low | ||
| R2 | 84.4000 | figure | S3 | 84.0850 | * | 28 Oct high | ||
| R1 | 84.3200 | * | intraday high | S4 | 83.9850 | ** | Sep high |
Asterisk denotes strength of level
05:10 GMT - Extending parabolic rally following break of the 84.0850/84.0950 October highs, to reach fresh all-time high at 84.3200. Further gains will see scope for extension to 84.4000 figure. Higher still, if seen, will see potential to the 84.5000 figure but deep overbought daily studies caution corrective pullback. Meanwhile, support is raised to the 84.2000 figure and extend to the 84.1600, mid-week low. This are now underpin and see break here needed to fade the upside pressure and see room for consolidation to the strong support at the 84.0850/83.9850, October/September highs.