Published: 2025-11-14T00:18:49.000Z
Chart AUD/USD Update: Back in range below .6550 resistance
-
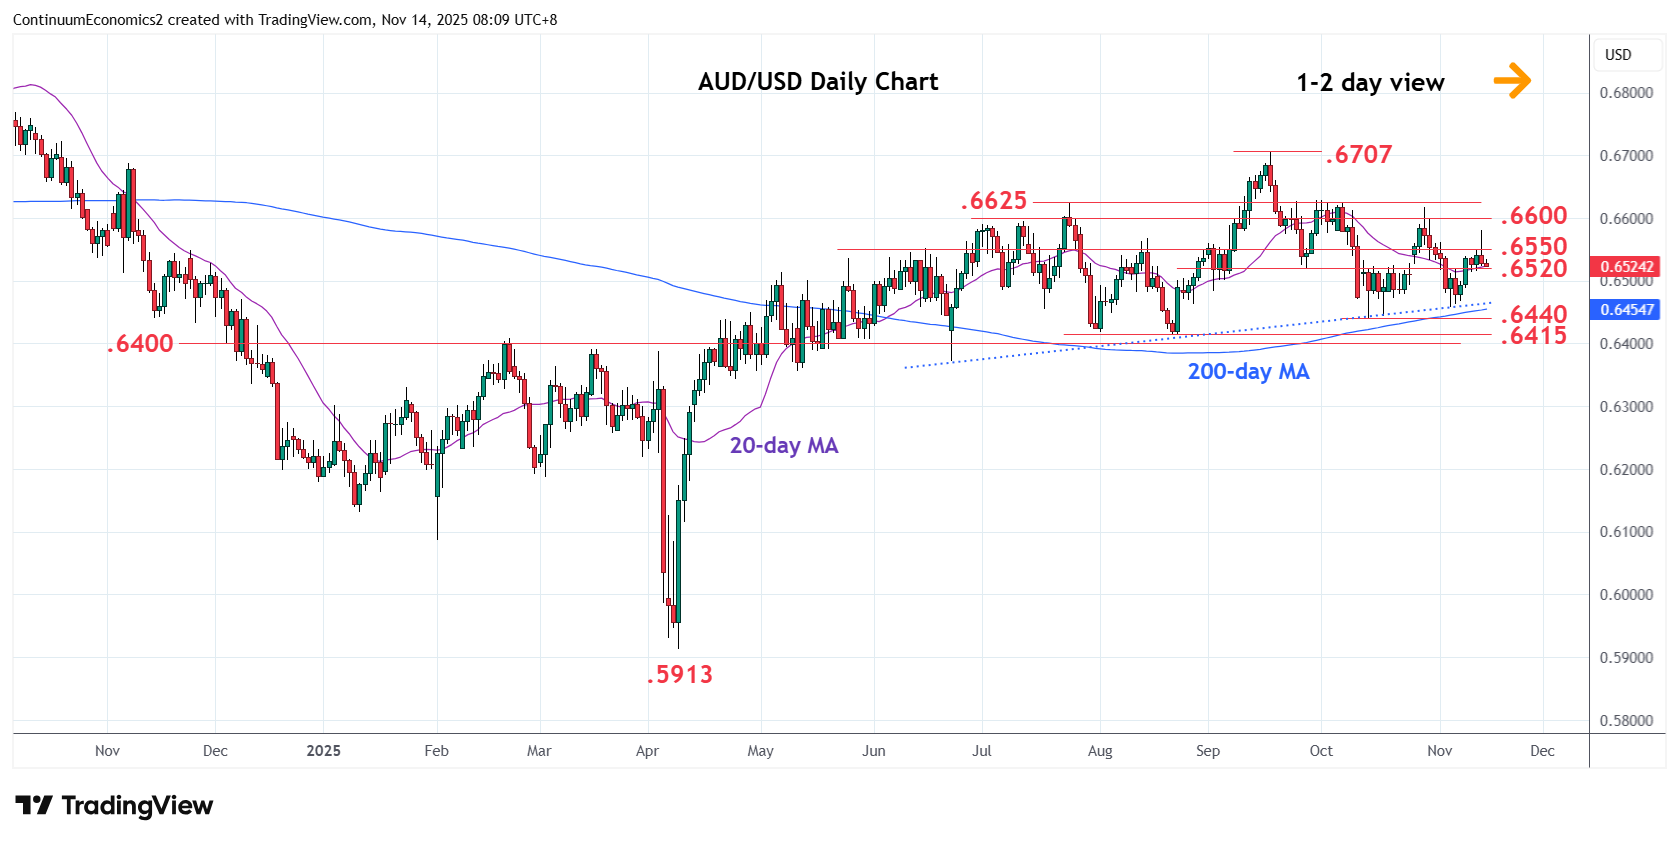
Failure to sustain break of the .6550 resistance see prices settling back into range from the .6580 spike high
| Levels | Imp | Comment | Levels | Imp | Comment | |||
|---|---|---|---|---|---|---|---|---|
| R4 | 0.6707 | ** | 17 Sep YTD high | S1 | 0.6500 | * | congestion | |
| R3 | 0.6625/30 | ** | Jul, Oct highs | S2 | 0.6458 | * | 5 Nov low | |
| R2 | 0.6600 | * | congestion | S3 | 0.6440 | ** | Oct low | |
| R1 | 0.6550 | * | congestion | S4 | 0.6415/00 | ** | Aug low, congestion |
Asterisk denotes strength of level
00:10 GMT - Failure to sustain break of the .6550 resistance see prices settling back into range from the .6580 spike high. Lower high from the latter see pressure returning to the .6520/.6500 support and threaten break here to open up room for pullback to retest the .6458 low of last week. Below this will turn focus to the critical .6440 and .6415, October and August lows. Meanwhile, resistance remains at the .6550 congestion. Close above here is needed to clear the way for retest of the .6600 level then the .6625/30, July/October highs.